Towards standardization of RNA quality assessment using user-independent classifiers of microcapillary electrophoresis traces
- PMID: 15800207
- PMCID: PMC1072807
- DOI: 10.1093/nar/gni054
Towards standardization of RNA quality assessment using user-independent classifiers of microcapillary electrophoresis traces
Abstract
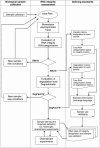
While it is universally accepted that intact RNA constitutes the best representation of the steady-state of transcription, there is no gold standard to define RNA quality prior to gene expression analysis. In this report, we evaluated the reliability of conventional methods for RNA quality assessment including UV spectroscopy and 28S:18S area ratios, and demonstrated their inconsistency. We then used two new freely available classifiers, the Degradometer and RIN systems, to produce user-independent RNA quality metrics, based on analysis of microcapillary electrophoresis traces. Both provided highly informative and valuable data and the results were found highly correlated, while the RIN system gave more reliable data. The relevance of the RNA quality metrics for assessment of gene expression differences was tested by Q-PCR, revealing a significant decline of the relative expression of genes in RNA samples of disparate quality, while samples of similar, even poor integrity were found highly comparable. We discuss the consequences of these observations to minimize artifactual detection of false positive and negative differential expression due to RNA integrity differences, and propose a scheme for the development of a standard operational procedure, with optional registration of RNA integrity metrics in public repositories of gene expression data.
Figures

Similar articles
-
RNA quality in frozen breast cancer samples and the influence on gene expression analysis--a comparison of three evaluation methods using microcapillary electrophoresis traces.BMC Mol Biol. 2007 May 22;8:38. doi: 10.1186/1471-2199-8-38. BMC Mol Biol. 2007. PMID: 17519006 Free PMC article.
-
RNA integrity and the effect on the real-time qRT-PCR performance.Mol Aspects Med. 2006 Apr-Jun;27(2-3):126-39. doi: 10.1016/j.mam.2005.12.003. Epub 2006 Feb 15. Mol Aspects Med. 2006. PMID: 16469371 Review.
-
Impact of RNA degradation on gene expression profiles: assessment of different methods to reliably determine RNA quality.J Biotechnol. 2007 Jan 20;127(4):549-59. doi: 10.1016/j.jbiotec.2006.07.032. Epub 2006 Aug 2. J Biotechnol. 2007. PMID: 16945445
-
Prediction of qualitative outcome of oligonucleotide microarray hybridization by measurement of RNA integrity using the 2100 Bioanalyzer capillary electrophoresis system.Ann Hematol. 2009 Dec;88(12):1177-83. doi: 10.1007/s00277-009-0751-5. Epub 2009 May 8. Ann Hematol. 2009. PMID: 19424697
-
Review paper: Gene expression profiling in veterinary and human medicine: overview of applications and proposed quality control practices.Vet Pathol. 2009 Jul;46(4):598-603. doi: 10.1354/vp.08-VP-0276-R-REV. Epub 2009 Mar 9. Vet Pathol. 2009. PMID: 19276055 Review.
Cited by
-
Low-dose oral interferon modulates expression of inflammatory and autoimmune genes in cattle.Vet Immunol Immunopathol. 2016 Apr;172:64-71. doi: 10.1016/j.vetimm.2016.03.006. Epub 2016 Mar 4. Vet Immunol Immunopathol. 2016. PMID: 27032505 Free PMC article. Clinical Trial.
-
Effect of storage time on gene expression data acquired from unfrozen archived newborn blood spots.Mol Genet Metab. 2016 Nov;119(3):207-213. doi: 10.1016/j.ymgme.2016.08.001. Epub 2016 Aug 18. Mol Genet Metab. 2016. PMID: 27553879 Free PMC article.
-
miR-29c is downregulated in renal interstitial fibrosis in humans and rats and restored by HIF-α activation.Am J Physiol Renal Physiol. 2013 May 15;304(10):F1274-82. doi: 10.1152/ajprenal.00287.2012. Epub 2013 Mar 6. Am J Physiol Renal Physiol. 2013. PMID: 23467423 Free PMC article.
-
The paraffin-embedded RNA metric (PERM) for RNA isolated from formalin-fixed, paraffin-embedded tissue.Biotechniques. 2016 May 1;60(5):239-44. doi: 10.2144/000114415. eCollection 2016. Biotechniques. 2016. PMID: 27177816 Free PMC article.
-
In search of suitable reference genes for gene expression studies of human renal cell carcinoma by real-time PCR.BMC Mol Biol. 2007 Jun 8;8:47. doi: 10.1186/1471-2199-8-47. BMC Mol Biol. 2007. PMID: 17559644 Free PMC article.
References
-
- Sambrook J., Fritsch E.F., Maniatis T. Molecular Cloning: A Laboratory Manual, 2nd edn. NY: Cold Spring Harbor Laboratory Press; 1989.
-
- Manchester K.L. Use of UV methods for measurement of protein and nucleic acid concentrations. Biotechniques. 1996;20:968–970. - PubMed
-
- Manchester K.L. Value of A260/A280 ratios for measurement of purity of nucleic acids. Biotechniques. 1995;19:208–210. - PubMed
-
- Glasel J.A. Validity of nucleic acid purities monitored by 260nm/280nm absorbance ratios. Biotechniques. 1995;18:62–63. - PubMed
Publication types
MeSH terms
Substances
LinkOut - more resources
Full Text Sources
Other Literature Sources

