. 2005 Apr;25(8):3220-31.
doi: 10.1128/MCB.25.8.3220-3231.2005.

Long-range interactions between three transcriptional enhancers, active Vkappa gene promoters, and a 3' boundary sequence spanning 46 kilobases

Affiliations

Long-range interactions between three transcriptional enhancers, active Vkappa gene promoters, and a 3' boundary sequence spanning 46 kilobases

Zhe Liu et al. Mol Cell Biol. 2005 Apr.

Abstract

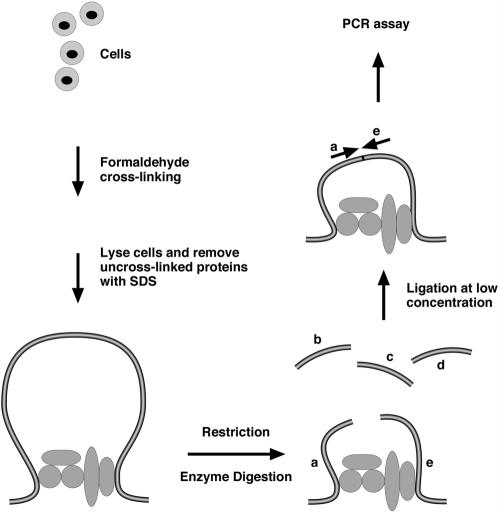
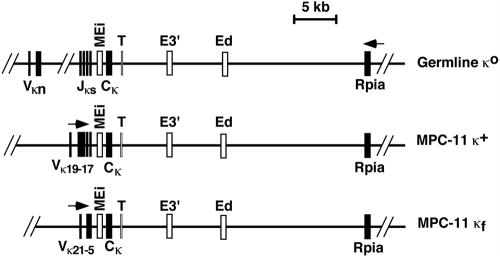
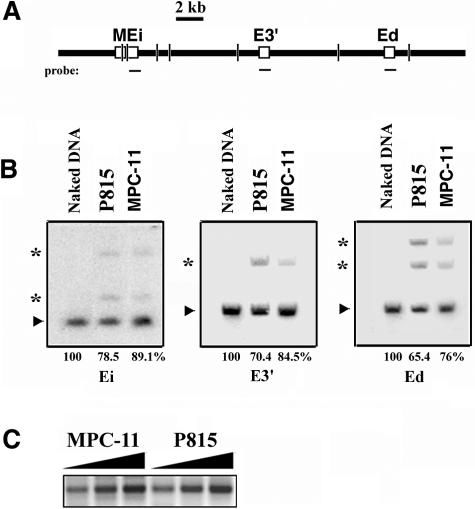
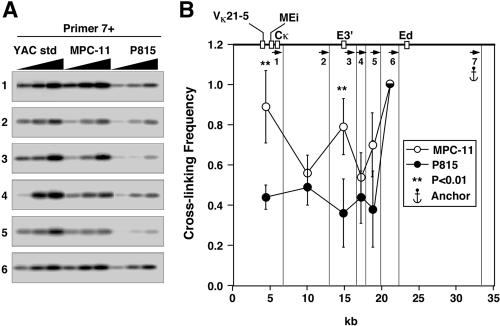
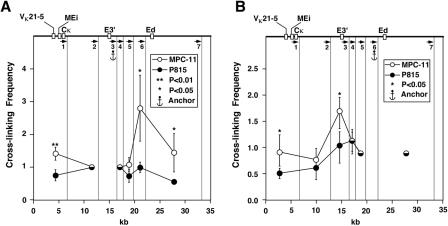
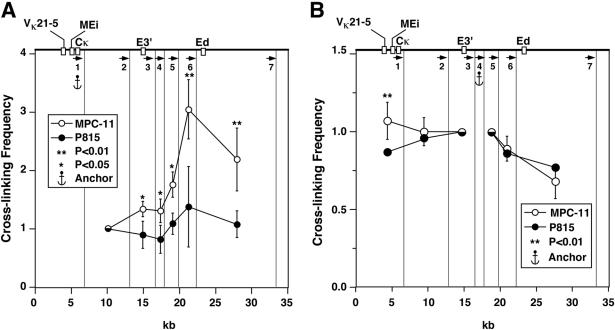
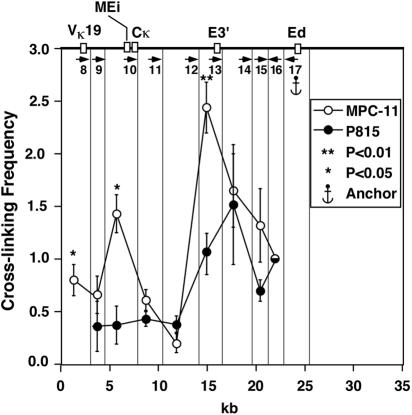
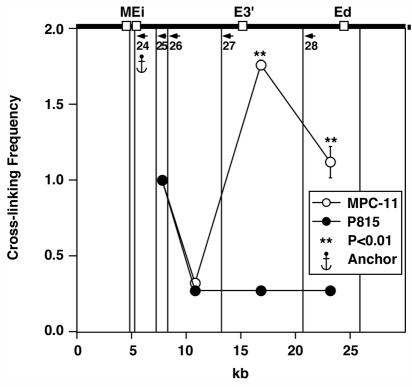
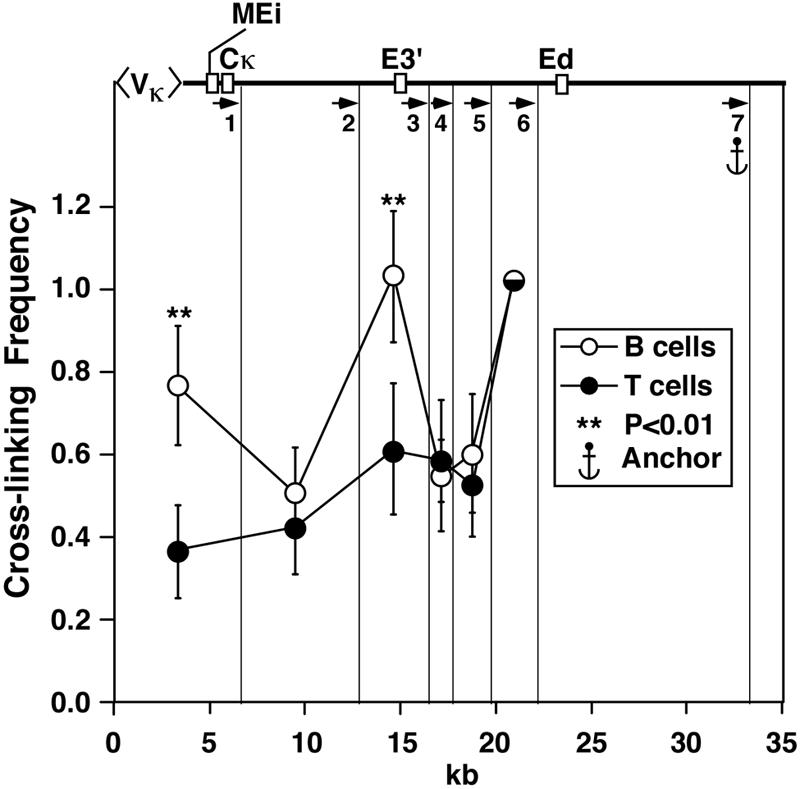
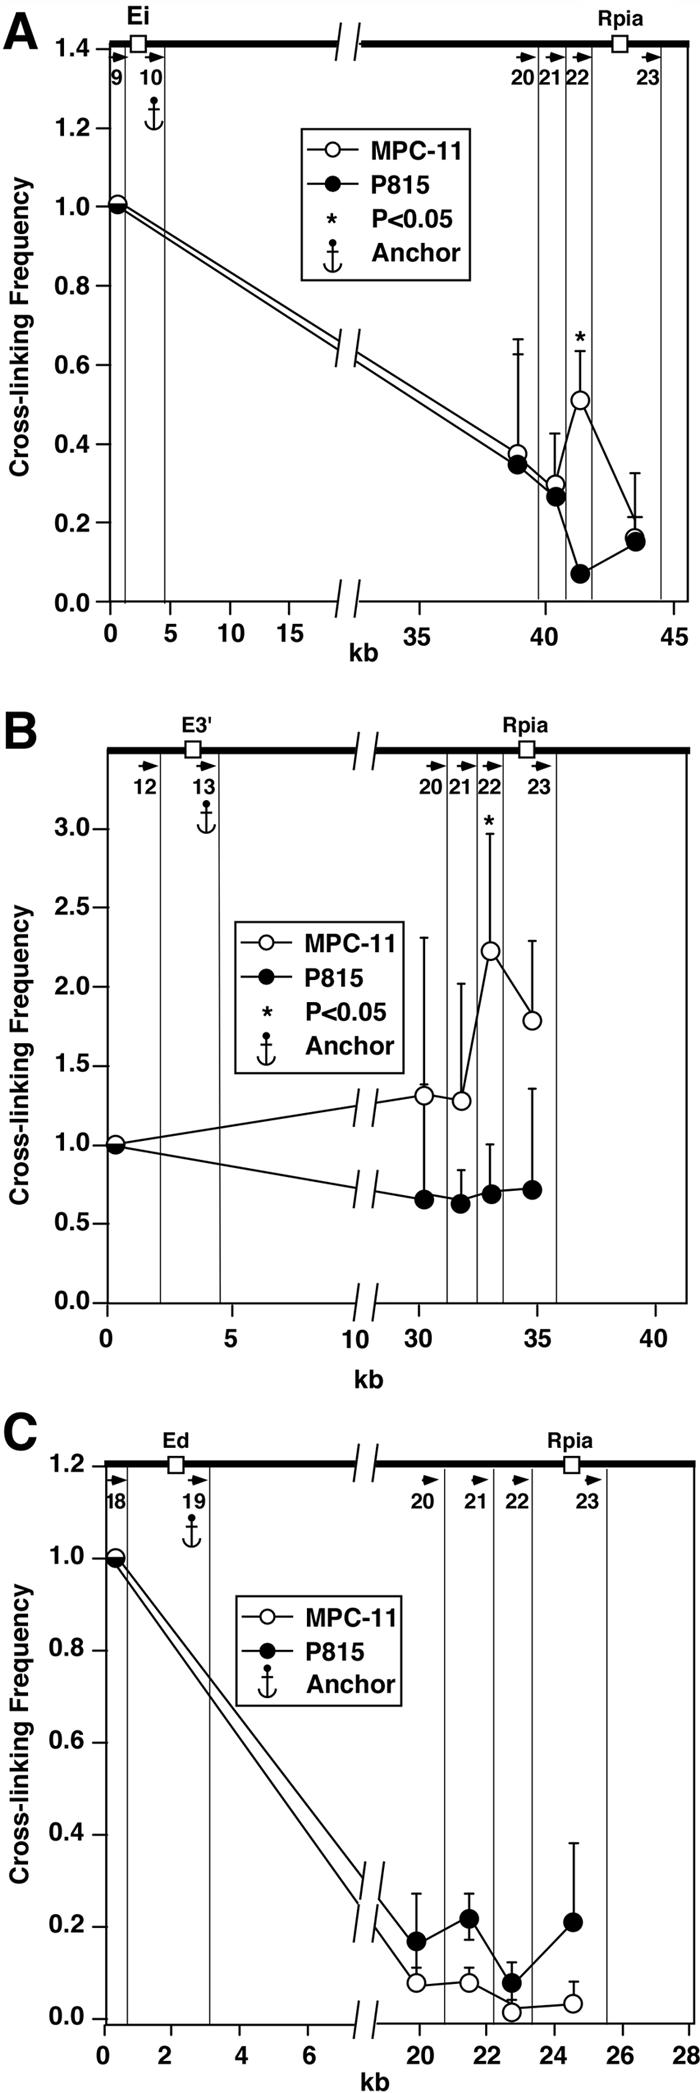
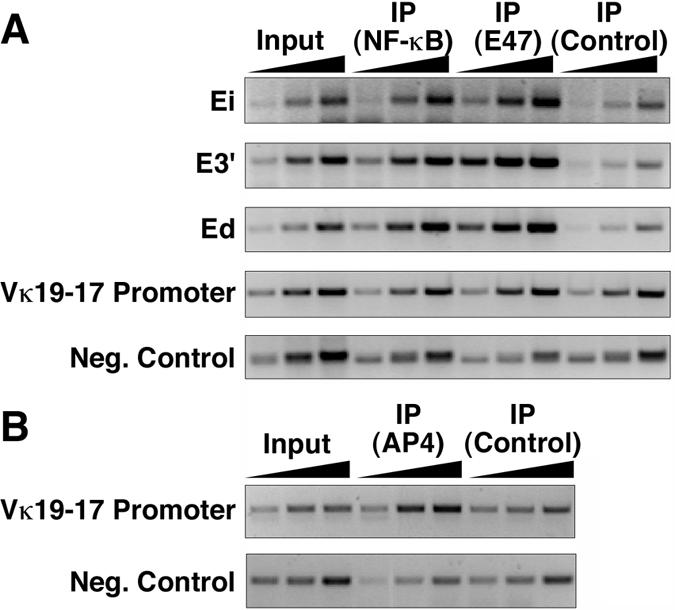
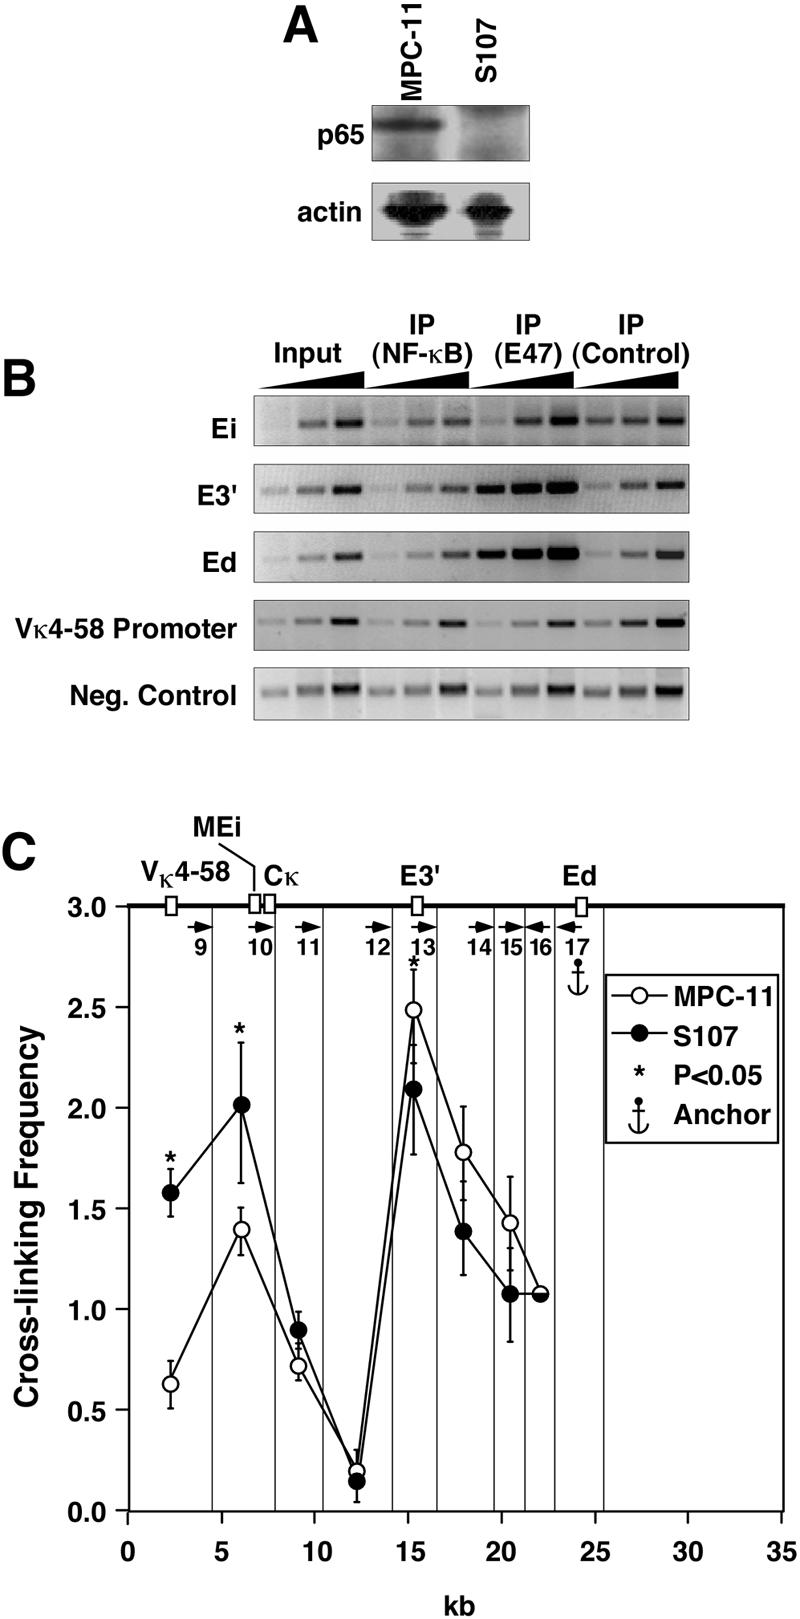
The mouse immunoglobulin kappa (Igkappa) gene contains an intronic enhancer and two enhancers downstream of its transcription unit. Using chromosome conformation capture technology, we demonstrate that rearranged and actively transcribed Igkappa alleles in MPC-11 plasmacytoma cells exhibit mutual interactions over 22 kb between these three enhancers and Vkappa gene promoters. In addition, the 5' region of the active transcription unit exhibits a continuum of interactions with downstream chromatin segments. We also observe interactions between Ei and E3' with 3' boundary sequences 24 kb downstream of Ed, adjacent to a neighboring housekeeping gene. Very similar interactions between the enhancers are also exhibited by normal B cells isolated from mouse splenic tissue but not by germ line transcriptionally inactive alleles of T cells or P815 mastocytoma cells, which exhibit a seemingly linear chromatin organization. These results fit a looping mechanism for enhancer function like in the beta-globin locus and suggest a dynamic modulation of the spatial organization of the active Igkappa locus. Chromatin immunoprecipitation experiments reveal that the interacting Igkappa gene cis-acting sequences are associated with AP-4, E47, and p65NF-kappaB, potential protein candidates that may be responsible for initiating and/or maintaining the formation of these higher-order complexes. However, S107 plasmacytoma cells that lack NF-kappaB still exhibit mutual interactions between the Igkappa gene enhancers.


Figures

FIG. 1.
FIG. 1.
Schematic representation of the chromosome conformation capture technology. Chromatin from formaldehyde-fixed cells is digested with a restriction enzyme and diluted for “intramolecular” ligation, and the resulting purified DNA fragments are assayed for specific ligation products by PCR amplification.
FIG. 2.
FIG. 2.
Genomic organization of Igκ alleles in MPC-11 and P815 cells. Exons are indicated by closed rectangles, and cis-acting sequences are indicated by open rectangles. The arrows indicate the direction of transcription. T represents the position of transcription termination (66). This map is based on data from reference .
FIG. 3.
FIG. 3.
Control 3C experiments. (A) Schematic representation of a segment of the Igκ locus. Short vertical lines indicate AseI cutting sites selected for the determination of the efficiencies of restriction enzyme digestion. Probes are shown below as horizontal lines. (B) Genomic Southern analysis of 15-μg purified DNA samples per lane, from digested naked DNA or digested cross-linked chromatin from P815 and MPC-11 cells as indicated. Arrowheads indicate the positions of completely digested fragments, which are 2.1, 7.1, and 5.5 kb for Ei, E3′, and Ed, respectively. Asterisks indicate the positions of partly digested fragments. For Ei, the partly digested fragment lengths are 2.4 and 3.1 kb. For E3′, the partly digested fragment length is 12.6 kb. For Ed, the partly digested fragment lengths are 8.8 and 12.6 kb. The digestion efficiencies of the enhancer bearing fragments were estimated by determining the fractional signal intensities obtained from the cross-linked chromatin samples relative to the naked DNA sample for the completely digested fragments and are shown at the bottom. (C) PCR-amplified 3C ligation products of the housekeeping gene which encodes porphobilinogen deaminase, after digestion with NspI, from MPC-11 and P815 cells, using 100, 200, and 300 ng of template DNA.
FIG. 4.
FIG. 4.
Plasmacytoma-cell-specific looping interactions between Ed, E3′, and VκMEi. (A) PCR-amplified ligation products. Primer 7 was used as an anchor and paired with all the other upstream primers. YAC std, YAC standard. (B) PCR signal quantification. The vertical lines show the cutting sites of MfeI, and the arrows indicate the primers used in PCRs. Standard deviations of the means are indicated. Significant differences are in comparison to P815. The most 5′ MfeI cut sites are not shown and differ for κ+, κf, and κ° alleles, generating restriction fragments that are 7.8, 6.7, and 18.3 kb long, respectively, each with the same 3′ end complementary to primer 1. Those derived from MPC-11 cells possess the entire Vκ19-17 and Vκ21-5 V genes, along with their upstream regulatory sequences. For simplicity the map at the top of panel B shows only the κf allele of MPC-11 cells.
FIG. 5.
FIG. 5.
Plasmacytoma-cell-specific looping interactions between E3′ and Ed, VκMEi, and a novel DNA segment, presented as described in the legend to Fig. 4. Significant differences are in comparison to P815. Quantification of PCR signals with primers 3 (A) and 6 (B) as anchors.
FIG. 6.
FIG. 6.
Plasmacytoma-cell-specific looping interactions between the transcription unit(s) and every other chromatin fragment downstream of the transcription termination region, presented as described in the legend to Fig. 4. Significant differences are in comparison to P815. (A) Quantification of PCR signals with primers 1 (A) and 4 (B) as anchors.
FIG. 7.
FIG. 7.
Plasmacytoma-cell-specific looping interactions between Ed and the other two enhancers and the promoter. A different restriction enzyme, NspI, was used in this experiment. Quantification of PCR signals with primer 17 as an anchor. The vertical lines indicate the NspI cutting sites that were selected for analysis of the looping interactions. Nineteen fragments were obtained in the region from the promoter to Ed after digestion with NspI. We chose to study the looping interactions within the fragments indicated by the vertical lines corresponding to the promoter of the Vκ19 gene, the three enhancers, the adjacent fragments (so that we could normalize the ligation efficiency between different experiments), and one or two fragments between the enhancers. Sequences complementary to primer 8 are far upstream of MEi (>300 kb) on the κf and κ° alleles of MPC-11 and P815 cells, and sequences complementary to primer 9 are similarly far upstream of MEi (>300 kb) on the κf allele of MPC-11 cells (Fig. 2) (8). Here, the anchor primer and the adjacent primer are pointing towards the other primers instead of having all the primers pointing in the same direction. This configuration, however, does not influence cross-linking frequency estimates because restriction digestion goes to near completion, and those trace products from uncut DNA are much longer than the 3C product and are not seen on gels whatsoever after PCR amplification. We designed our 3C primer pairs to yield products generally between 100 and 250 bp in length, whereas the sizes of the PCR products resulting from primer 17 paired with primers 15 and 14 in uncut DNA would be 0.7 and 3 kb, respectively. These and longer bands are not observed in our experiments. In addition, the primers are in vast molar excess and are not depleted upon the completion of the PCR cycles. Thus, cross-linking frequencies are not being underestimated because of primer competition for PCR products.
FIG. 8.
FIG. 8.
Plasmacytoma-cell-specific looping interactions between Ei and the other two enhancers. The quantification of PCR signals with primer 24 as the anchor is shown. The vertical lines indicate the AseI cutting sites that were selected for analysis of the looping interactions.
FIG. 9.
FIG. 9.
B-lymphocyte-specific interactions between Ed and E3′ and VκMEi, presented as described in the legend to Fig. 4. Quantification of PCR signals with primer 7 as an anchor is shown. Significant differences are in comparison to P815. The vertical lines indicate the MfeI cutting sites.
FIG. 10.
FIG. 10.
Plasmacytoma-cell-specific looping interactions between the enhancers, Ei and E3′, and a downstream boundary. Quantification of PCR signals with primers 10 (A), 13 (B), and 19 (C). We chose to study the looping interactions between the NspI fragments indicated by the vertical lines.
FIG. 11.
FIG. 11.
Occupancy of p65NF-κB, E47, and AP-4 transcription factors on Igκ gene enhancer and promoter sequences of MPC-11 cells. Semiquantitative PCRs were performed by using 1, 3, and 9 ng of DNA templates with the indicated input, bound, and preimmune control fractions. (A) ChIP with antibodies against p65NF-κB, E47, and a preimmune control. (B) ChIP with antibodies against AP-4 transcription factor and a preimmune control.
FIG. 12.
FIG. 12.
S107 plasmacytoma cells, which lack NF-κB, still exhibit prominent interactions between Igκ gene cis-acting sequences. (A) Western blot of nuclear protein extracts from MPC-11 and S107 cells showing the absence of p65NF-κB in S107 samples but not MPC-11 samples. Probing the same blot with anti-actin antibodies serves as a loading and protein integrity control. (B) Semiquantitative PCRs were performed by using 1, 3, and 9 ng of DNA templates with the indicated input, bound, and preimmune control fractions with antibodies against p65NF-κB or E47 transcription factors as indicated. (C) Comparison of S107 and MPC-11 plasmacytoma-cell-specific looping interactions between Ed and the other two enhancers. Also assayed for were interactions between the Vκ4-58 gene promoter, which is rearranged to Jκ4 in S107 cells (8, 31, 32), and Ed. Quantification of PCR signals with primer 17 as an anchor is shown. The vertical lines indicate the NspI cutting sites that were selected for analysis of the looping interactions. Data from MPC-11 is taken from Fig. 7, and the asterisks specifically indicate what interactions are statistically significant for a comparison between S107 and P815 cells from Fig. 7 data. It should be noted that NspI fragment 9 does not include the Vκ19-17 promoter from MPC-11 cells, which is on the next upstream restriction fragment (see Fig. 7).

Similar articles

Cited by

References

    1. Abney, J. R., B. Butler, M. L. Fillbach, D. Axelrod, and B. A. Scalettar. 1997. Chromatin dynamics in interphase nuclei and its implications for nuclear structure. J. Cell Biol. 137:1459-1468. - PMC - PubMed
    1. Aranburu, A., R. Carlsson, C. Persson, and T. Leanderson. 2001. Transcription factor AP-4 is a ligand for immunoglobulin-κ promoter E-box elements. Biochem. J. 354:431-438. - PMC - PubMed
    1. Atchison, M. L., and R. P. Perry. 1987. The role of the κ enhancer and its binding factor NF-kB in the developmental regulation of κ gene transcription. Cell 48:121-128. - PubMed
    1. Bain, G., E. C. R. Maandag, H. P. J. te Riele, A. J. Freeney, A. Sheehy, M. Schlissel, S. A. Shinton, R. R. Hardy, and C. Murre. 1997. Both E12 and E47 allow commitment to the B cell lineage. Immunity 6:145-154. - PubMed
    1. Baxter, J., M. Merkenschlager, and A. G. Fisher. 2002. Nuclear organization and gene expression. Curr. Opin. Cell Biol. 14:372-376. - PubMed

Publication types

MeSH terms

LinkOut - more resources