

Genomic characterization reveals a simple histone H4 acetylation code
- PMID: 15795371
- PMCID: PMC555684
- DOI: 10.1073/pnas.0500136102
Genomic characterization reveals a simple histone H4 acetylation code
Abstract
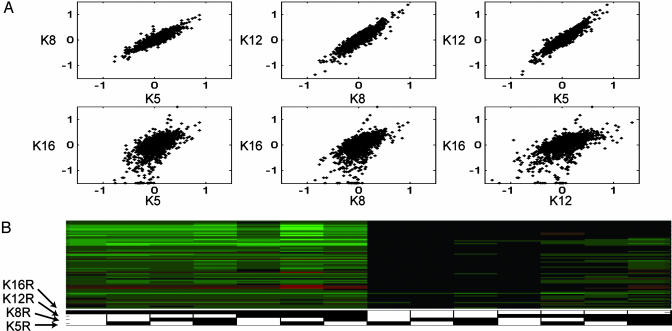
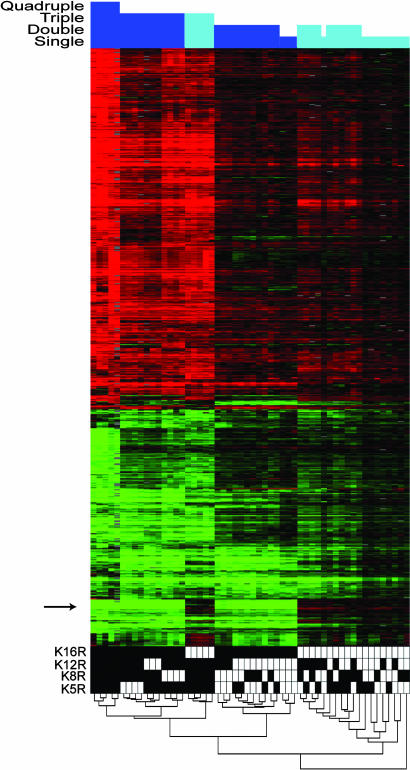
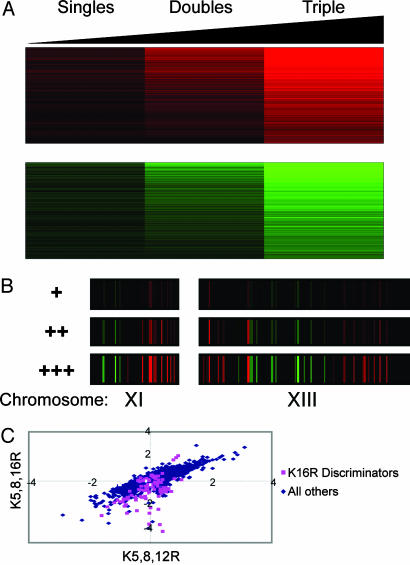
The histone code hypothesis holds that covalent posttranslational modifications of histone tails are interpreted by the cell to yield a rich combinatorial transcriptional output. This hypothesis has been the subject of active debate in the literature. Here, we investigated the combinatorial complexity of the acetylation code at the four lysine residues of the histone H4 tail in budding yeast. We constructed yeast strains carrying all 15 possible combinations of mutations among lysines 5, 8, 12, and 16 to arginine in the histone H4 tail, mimicking positively charged, unacetylated lysine states, and characterized the resulting genome-wide changes in gene expression by using DNA microarrays. Only the lysine 16 mutation had specific transcriptional consequences independent of the mutational state of the other lysines (affecting approximately 100 genes). In contrast, for lysines 5, 8, and 12, expression changes were due to nonspecific, cumulative effects seen as increased transcription correlating with an increase in the total number of mutations (affecting approximately 1,200 genes). Thus, acetylation of histone H4 is interpreted by two mechanisms: a specific mechanism for lysine 16 and a nonspecific, cumulative mechanism for lysines 5, 8, and 12.
Figures
Comment in
-
Histone modifications: combinatorial complexity or cumulative simplicity?Proc Natl Acad Sci U S A. 2005 Apr 12;102(15):5308-9. doi: 10.1073/pnas.0501853102. Epub 2005 Apr 5. Proc Natl Acad Sci U S A. 2005. PMID: 15811936 Free PMC article. No abstract available.
Similar articles
-
Histone modifications: combinatorial complexity or cumulative simplicity?Proc Natl Acad Sci U S A. 2005 Apr 12;102(15):5308-9. doi: 10.1073/pnas.0501853102. Epub 2005 Apr 5. Proc Natl Acad Sci U S A. 2005. PMID: 15811936 Free PMC article. No abstract available.
-
Redundant roles for histone H3 N-terminal lysine residues in subtelomeric gene repression in Saccharomyces cerevisiae.Genetics. 2004 Jul;167(3):1123-32. doi: 10.1534/genetics.104.026674. Genetics. 2004. PMID: 15280228 Free PMC article.
-
Mapping global histone acetylation patterns to gene expression.Cell. 2004 Jun 11;117(6):721-33. doi: 10.1016/j.cell.2004.05.023. Cell. 2004. PMID: 15186774
-
Acetylation of yeast histone H4 lysine 16: a switch for protein interactions in heterochromatin and euchromatin.Cold Spring Harb Symp Quant Biol. 2004;69:193-200. doi: 10.1101/sqb.2004.69.193. Cold Spring Harb Symp Quant Biol. 2004. PMID: 16117649 Review. No abstract available.
-
Genome-wide patterns of histone modifications in yeast.Nat Rev Mol Cell Biol. 2006 Sep;7(9):657-66. doi: 10.1038/nrm1986. Epub 2006 Aug 16. Nat Rev Mol Cell Biol. 2006. PMID: 16912715 Review.
Cited by
-
Applying whole-genome studies of epigenetic regulation to study human disease.Cytogenet Genome Res. 2006;114(1):1-15. doi: 10.1159/000091922. Cytogenet Genome Res. 2006. PMID: 16717444 Free PMC article. Review. No abstract available.
-
Oliver Rando: taking chromatin analysis to the genomic scale. Interview by Ruth Williams.J Cell Biol. 2007 Jun 18;177(6):948-9. doi: 10.1083/jcb.1776pi. J Cell Biol. 2007. PMID: 17576793 Free PMC article.
-
Physical Chemistry of Epigenetics: Single-Molecule Investigations.J Phys Chem B. 2019 Oct 10;123(40):8351-8362. doi: 10.1021/acs.jpcb.9b06214. Epub 2019 Aug 30. J Phys Chem B. 2019. PMID: 31404497 Free PMC article. Review.
-
Genome-wide patterns of histone modifications in fission yeast.Chromosome Res. 2006;14(1):95-105. doi: 10.1007/s10577-005-1023-4. Chromosome Res. 2006. PMID: 16506099
-
Histone modifications: from genome-wide maps to functional insights.Genome Biol. 2005;6(6):113. doi: 10.1186/gb-2005-6-6-113. Epub 2005 May 31. Genome Biol. 2005. PMID: 15960810 Free PMC article. Review.
References
-
- Turner, B. M. (2000) Bioessays 22, 836–845. - PubMed
-
- Strahl, B. D. & Allis, C. D. (2000) Nature 403, 41–45. - PubMed
-
- Schreiber, S. L. & Bernstein, B. E. (2002) Cell 111, 771–778. - PubMed
-
- Kurdistani, S. K. & Grunstein, M. (2003) Nat. Rev. Mol. Cell. Biol. 4, 276–284. - PubMed
-
- Dhalluin, C., Carlson, J. E., Zeng, L., He, C., Aggarwal, A. K. & Zhou, M. M. (1999) Nature 399, 491–496. - PubMed
Publication types
MeSH terms
Substances
LinkOut - more resources
Full Text Sources
Other Literature Sources
Molecular Biology Databases
