. 2005 Jun;88(6):4124-36.
doi: 10.1529/biophysj.104.056945. Epub 2005 Mar 18.

Braiding DNA: experiments, simulations, and models

Affiliations

Braiding DNA: experiments, simulations, and models

G Charvin et al. Biophys J. 2005 Jun.

Abstract

DNA encounters topological problems in vivo because of its extended double-helical structure. As a consequence, the semiconservative mechanism of DNA replication leads to the formation of DNA braids or catenanes, which have to be removed for the completion of cell division. To get a better understanding of these structures, we have studied the elastic behavior of two braided nicked DNA molecules using a magnetic trap apparatus. The experimental data let us identify and characterize three regimes of braiding: a slightly twisted regime before the formation of the first crossing, followed by genuine braids which, at large braiding number, buckle to form plectonemes. Two different approaches support and quantify this characterization of the data. First, Monte Carlo (MC) simulations of braided DNAs yield a full description of the molecules' behavior and their buckling transition. Second, modeling the braids as a twisted swing provides a good approximation of the elastic response of the molecules as they are intertwined. Comparisons of the experiments and the MC simulations with this analytical model allow for a measurement of the diameter of the braids and its dependence upon entropic and electrostatic repulsive interactions. The MC simulations allow for an estimate of the effective torsional constant of the braids (at a stretching force F = 2 pN): C(b) approximately 48 nm (as compared with C approximately 100 nm for a single unnicked DNA). Finally, at low salt concentrations and for sufficiently large number of braids, the diameter of the braided molecules is observed to collapse to that of double-stranded DNA. We suggest that this collapse is due to the partial melting and fraying of the two nicked molecules and the subsequent right- or left-handed intertwining of the stretched single strands.


Figures

FIGURE 1
FIGURE 1
Geometric model for DNA braiding. (a) The case |n| < 0.5, where simple geometric considerations allow one to derive the extension z(n) as a function of the angle 2πn, the length z0 = z(n = 0), and the distance 2e between the molecules of formula image (b) The case |n| > 0.5, where further braiding leads to the formation of a helix with diameter Db, so that the extension z(n) follows formula image This model remains valid as long as the molecules are not in close contact, a condition reached when formula image i.e., when the braid angle α reaches αc = 45° (see Materials and Methods for details).
FIGURE 2
FIGURE 2
Measurements of correlation in the generation of Monte Carlo configurations. (a) Open circle is the error on mean (δ) as a function of bin-size Nb (see text for details) obtained at n = 6 (with 2e/L0 = 0.36 and DDNA = 6 nm). Solid line is the curve obtained by fitting the numerical data to formula image NC yields an estimate of the number of correlated steps. In the case where n = 6, we obtained NC = 660,000. (b) Open square is the variation of NC with the number of applied turns n, and exponential fit as NC = A exp(Bn), with A = 23,000 and B = 0.47. The higher the braiding number, the larger the number of MC configurations required to characterize the chain.
FIGURE 3
FIGURE 3
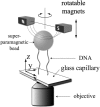
Sketch of the experimental setup. Two DNA molecules are multipally tagged at their extremities with biotin and digoxygenin (DIG), so that they can be attached to a streptavidin-coated superparamagnetic bead and to an anti-DIG-coated glass surface. Translation and rotation of small magnets close to the DNA molecules by a few-mm change of the applied force and the number of braids, respectively. The DNA molecule's extension is measured by tracking the position of the bead using an inverted microscope (see Materials and Methods for details).
FIGURE 4
FIGURE 4
Force versus extension curve for one (left plot) and two (right plot) DNA molecules tethered to the same bead. The value F1mol is the actual force felt by one molecule, i.e., F1mol = F in case of one tethering molecule, and F1mol = F/2 in case of two molecules, where F is the stretching force. Open squares are the experimental points obtained with a single DNA molecule. Error bars indicate statistical error. The best fit (solid line) to the worm-like chain (WLC) model yields a persistence length ξ = 46 ± 5 nm. Open diamonds are the experimental points obtained on different sets of two DNA molecules; the fit (solid line) using the WLC model yields ξ = 44 ± 4 nm. Shaded crosses are the results obtained using a Monte Carlo simulation of the stretching of one (left plot) or two (right plot) unbraided molecules of persistence length 46 nm, according to the procedure described in Materials and Methods. Statistical errors of simulated curves are smaller than the size of the symbols. Small deviations from the WLC model at forces >2 pN are due to chain discretization (Vologodskii, 1994).
FIGURE 5
FIGURE 5
Extension versus braiding for two DNA molecules and sketches of the expected geometry of the braid. The open diamonds are experimental points, obtained at F = 2 pN in 100 mM PB. We distinguish three regimes of braiding, based on the geometrical model described in the text: (I) the regime |n| < 0.5, characterized by a sharp variation with n of the extension, before the crossing of the two molecules; (II) the regime |n| > 0.5, where the molecules are intertwined; and (III) the regime |n| > nc, where the braids buckle and form plectonemes (supercoils of braids). Error bars indicate the statistical errors. A fit of the experimental data to the geometric model (in regimes I and II) yield the intermolecular spacing of 2e = 1.28 ± 0.02 μm and braids' diameter of Db = 8.2 ± 0.2 nm (shaded line). The line in regime III is a linear fit to the data in the plectonemic regime. The schematics represent the expected geometry of the braid in the different regimes.
FIGURE 6
FIGURE 6
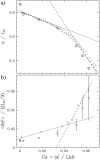
Experimental and numerical characterization of the braids' plectonemic regime. (a) Normalized extension (z/L0 where L0 = 3.56 μm is the molecules' length) versus catenation density Ca = |n|/Lk0 for n > 0 (shaded diamonds) and n < 0 (open diamonds; F = 2 pN in 100 mM PB + 5 mM MgCl2). Error bars indicate the statistical error. Notice the slight difference between left-handed (L; negative, n < 0) and right-handed (R; positive, n > 0) braids at high catenation density. This difference reflects the right-handed chirality of the DNA molecules, which can be positively braided to a larger extent before buckling than negative (left-handed) braids. Open circles are the numerical simulations of the braiding of two WLC polymers of extension L0 = 1.2 μm, intermolecular distance 2e/L0 = 0.36, and effective diameter DDNA = 4.2 nm, determined from the ionic conditions of the experiments (Rybenkov et al., 1997). (Dashed lines mark the differences in slope between the two regimes of braiding.) (b) Averaged normalized fluctuations in the braid's extension 〈δz2〉/(ξL0/3) as a function of Ca for the experimental (shaded diamonds, n > 0) and the simulated (open circles) runs shown in a. The fluctuations increase for Ca > 0.05, i.e., the system becomes more flexible as expected from the formation of supercoils of braids. The dashed lines mark the differences between the two regimes of braiding. Notice that the error bars in the estimate of the fluctuations in extension (from MC simulations) are larger than in the estimate of the mean extension. The dashed lines in both a and b cross at the same value of Ca, which indicates that the transition to supercoils of braids is associated with both a structural change (formation of plectonemes) and a decrease in stiffness (increase in fluctuations).
FIGURE 7
FIGURE 7
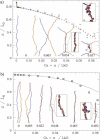
Relative extension z/L0 versus catenation density Ca in numerical simulation of the braiding of two polymer chains and comparison with the experimental data in 100 mM PB (same molecule as in Fig. 8 but in different ionic conditions). (a) Normalized extension as a function of Ca obtained in an MC simulation of two chains of extension L0 = 1.2 μm, intermolecular distance 2e/L0 = 0.36 at F = 2 pN using an effective DNA diameter DDNA = 6 nm (blue circles, corresponding to the experimental ionic conditions), DDNA = 5 nm (red circles), and DDNA = 4.2 nm (green circles). The open diamonds are experimental data. The solid line is a fit of the numerical data to the geometric model (described in the text) with a braid's diameter Db = 8.8 nm > DDNA = 6 nm due to entropic repulsion. The errors bars in the estimates of the simulated extension are smaller than the size of the symbols. (b) Numerical results obtained using 2e/L0 = 0.02 (open circles). The solid line is a fit of the numerical data to the geometric model with Db = 7.4 nm. The schematics display some typical braid configurations obtained at various Ca values indicated below each structure. Note that all these simulations were done with Ca > 0 (the braid helix is right-handed), but identical results were obtained with Ca < 0, since we do not take DNA chirality in the simulation into account.
FIGURE 8
FIGURE 8
Force versus Ca (Ca > 0) phase diagram for the buckling of braids (with 2e/L0 ≪ 1). The MC simulations of braids at various forces and catenation densities (Ca) allow us to determine the limit between buckled and unbuckled states. The black points display the position of the buckling transition at a given Ca. Error bars represent statistical error. The thick shaded line indicates the position of the buckling line. Typical conformations in each phase (buckled or unbuckled) are shown. The dimensionless unit used on the y axis involved the persistence length ξ of a single DNA molecule.
FIGURE 9
FIGURE 9
Determination of the torque in the braid. (a) Schematics: the torque is estimated by calculating the deviation angle β between the two vectors τ1 and τ2 between the anchoring points (see text for details). (b) Regime n < 1/2. The points display the values estimated from the simulations, whereas the solid line is the torque expected from the geometric model (when 2e/L0 = 0.36, with no fit parameter). (c) The regime n > 1/2. Results from numerical simulations at 2e/L0 (solid squares) and 2e/L0 = 0.02 (shaded squares) and comparison with the estimates from the geometric model (solid and shaded curves, respectively). Clearly the model fails to predict the variation of Γ with n, in particular when 2e/L0 ≪ 1. Errors bars indicate statistical errors. (The solid and shaded dashed lines are linear fits to the numerical data from which we compute the torsional modulus of the braids, Cb, 63 ± 6 nm kBT and 48 ± 1 nm kBT, respectively.)
FIGURE 10
FIGURE 10
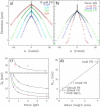
Dependence of the braid diameter Db on force and ionic conditions. (a) Extension versus n curves in 10 mM phosphate buffer (PB) at different stretching forces and fits using the geometrical model (solid lines); red circle, 4 pN; green diamond, 2 pN; light-blue circle, 1 pN; and dark-blue circle, 0.5 pN. (b) Extension versus n curves at F = 1 pN and fits using the geometrical model (solid lines); red circle, 1 mM PB; light-blue circle, 10 mM PB; and dark-blue circle, 100 mM PB. (c) Evolution with the force of the fitted diameter of the braids Db at different ionic concentrations: red circle, 1 mM PB; blue circle, 10 mM PB; green circle, 100 mM PB; and magenta circle, 100 mM PB + 5 mM MgCl2. Error bars indicate the error (determined by bootstrap test) on the diameter fitted using the geometrical model. Following Marko (1997), Db was fitted by Db = AF−3/4 + Db,∞. (d) Evolution of Db,∞ (circle) with the Debye length of λD, calculated by Zhang et al. (2001) at the corresponding ionic concentration. Error bars indicate the error on Db,∞, which has been fitted using least-square methods. A linear fit yields Db,∞ = 2.5 λD + 3.6 nm.
FIGURE 11
FIGURE 11
Torque-induced collapse of the braids. (a) Extension z versus catenation number (n) at 1 mM PB and F = 2 pN, with increasing (or decreasing) n shaded (or open) circles. At sufficiently high |n| (in the plectonemic regime of braids), a hysteretic transition occurs (with a noticeable jump in extension; see arrows at n = −34 and n = 35) to a state characterized by a smaller decrease in extension per turn (Strick et al., 1998), dz/dn. In that state (i.e., for |n| > 35), dz/dn formula image 4 nm/turn, whereas it is formula image 32 nm/turn at small n. This observation suggests that the structure of braids in that state is very compact (with a braid diameter approximately eight times smaller than for small n). (b) Real-time observation of braid collapse. Recording of the extension z (open squares) and the set value of n (continuous line) as a function of time. Notice the quick and spontaneous increase in z at n = −35. Unlinking the molecules back to n = 0 reproduces the initial configuration.
FIGURE 12
FIGURE 12
Model for the collapse transition observed in low ionic conditions. At small linking number, nicked double-stranded DNAs wrap around each other, thus reducing the system's extension (center). Beyond a critical linking number, the torque in the braids induces the melting of the molecules and the extrusion of single strands (right). The remaining (braided and stretched) single strands wind around each other in a helix that is tighter than the braid formed by two dsDNAs, thus increasing sharply the system's extension.

Similar articles

Cited by

References

    1. Adams, D., E. Shekhtman, E. Zechiedrich, M. Schmid, and N. Cozzarelli. 1992. The role of topoisomerase IV in partitioning bacterial replicons and the structure of catenated intermediates in DNA replication. Cell. 71:277–288. - PubMed
    1. Bouchiat, C., and M. Mézard. 1998. Elasticity theory of a supercoiled DNA molecules. Phys. Rev. Lett. 80:1556–1559.
    1. Bryant, Z., M. D. Stone, J. Gore, S. B. Smith, N. R. Cozzarelli, and C. Bustamante. 2003. Structural transitions and elasticity from torque measurements on DNA. Nature. 424:338–341. - PubMed
    1. Charvin, G., V. Croquette, and D. Bensimon. 2003. Single molecule study of DNA unlinking by eukaryotic and prokaryotic type II topoisomerases. Proc. Natl. Acad. Sci. USA. 100:9820–9825. - PMC - PubMed
    1. Charvin, G., T. Strick, J.-F. Allemand, V. Croquette, and D. Bensimon. 2004. Twisting DNA: single molecules studies. Contemp. Phys. 45:383–403.

Publication types