. 2005 May;16(5):2443-57.
doi: 10.1091/mbc.e04-12-1116. Epub 2005 Mar 9.

Myosin-1a is critical for normal brush border structure and composition

Affiliations

Myosin-1a is critical for normal brush border structure and composition

Matthew J Tyska et al. Mol Biol Cell. 2005 May.

Abstract

To develop our understanding of myosin-1a function in vivo, we have created a mouse line null for the myosin-1a gene. Myosin-1a knockout mice demonstrate no overt phenotypes at the whole animal level but exhibit significant perturbations and signs of stress at the cellular level. Among these are defects in microvillar membrane morphology, distinct changes in brush-border organization, loss of numerous cytoskeletal and membrane components from the brush border, and redistribution of intermediate filament proteins into the brush border. We also observed significant ectopic recruitment of another short-tailed class I motor, myosin-1c, into the brush border of knockout enterocytes. This latter finding, a clear demonstration of functional redundancy among vertebrate myosins-I, may account for the lack of a whole animal phenotype. Nevertheless, these results indicate that myosin-1a is a critical multifunctional component of the enterocyte, required for maintaining the normal composition and highly ordered structure of the brush border.


Figures

Figure 1.
Figure 1.
(A) Schematic representation of Myo1a genomic structure (WT), structure of the construct devised for Myo1a targeting (construct), and the result following recombination (KO). The neo/ura selection cassette is positioned to replace the first three exons of Myo1a. Exons are shown as cross-hatched boxes; native restriction sites (SmaI and BamHI), ATG start site, and ATP binding sites are flagged for reference. F1 and B1 mark the positions of genomic PCR primer binding sites. (B) PCR with genomic template from WT and homozygous KO mice. Products of expected size were observed (2808 base pairs for WT and 5119 base pairs for KO); cutting with EcoRI confirmed the introduction of two new restriction sites in the KO. Note that three KO fragments are produced with EcoRI (2623, 1303, and 1193 base pairs), but two are nearly identical in size and not resolved by the gel. (C) Anti-Myo1a immunoblots on whole gut (WG), mucosal homogenate (MH), and crude BB (CBB) fractions from WT and homozygous KO small intestines (loaded for equal total protein). (D) Staining of WT and KO duodenal sections with anti-Myo1a (green) and phalloidin (red). Bar, 10 μm.
Figure 8.
Figure 8.
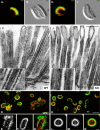
Fluorescence (A and H) and differential interference contrast (B and I) microscopy of BBs isolated from WT (A and B) and KO (H and I) mice. Although KO BBs were isolated with membrane (green, ConA) and actin cytoskeleton (red, phalloidin) intact (H), they seem more disheveled (I) relative to WT BBs from the same preparation. (C and J) TEM on isolated BBs incubated in high Mg2+; the lateral bridges that are obvious in WT MV (C, inset) are absent in KO (J, inset). Phalloidin (red) stabilized WT (D–G) and KO (K–N) BBs were fixed and labeled with ConA (green) 15 min after addition of 1 mM ATP. Higher magnification reveals that ATP-induced membrane shedding is evident in WT (E, ConA; F, phalloidin; G, overlay) but not KO (L, ConA; M, phalloidin; N, Overlay). Bars are 1 μm (A, B, H, and I), 250 nm (C and J), 50 nm (insets in C and J), 10 μm (D and K), and 2 μm (E, F, G, L, M, and N).
Figure 10.
Figure 10.
(A) Fractionation of equal amounts (assessed by total protein) of WT and KO enterocytes. In KO, Myo1c is enriched in the BB-rich LSP and lost from the basolateral membrane-rich (BL) LSS, as well as HSP and USP fractions. (B) Immunostaining of WT and KO duodenal sections shows Myo1c redistribution into KO BBs (white arrowheads); the pronounced basolateral staining observed in WT sections is muted; bars are 10 μm. (C) Optiprep density gradient analysis of detergent-insoluble fractions prepared from equal quantities (assessed by total protein) of WT and KO BBs; Coomassie Blue-stained gels loaded for equal volume are shown. Fraction 1 represents the top of the gradient (lowest density). Immunoblots for Myo1a (D), Myo1c (E), and SI (F) reveal that in the absence of Myo1a, total gradient levels of SI are slightly reduced and Myo1c is recruited into the lowest density, raft-rich fraction (1).
Figure 2.
Figure 2.
(A) Age-matched WT and KO mice (8 wk old) appear no different. (B) Total stool produced over a 6-h period from five WT and five KO mice. (C) Paraffin sections of WT and KO duodenum stained with H&E. Bars, 100 μm. (D) KO paraffin sections exhibit significantly higher levels of TUNEL staining (WT, 0.5 ± 0.3, n = 27 sections vs. KO, 1.8 ± 1.5, n = 31 sections; *p < 0.0005). Values for the total TUNEL intensity per section were normalized to the highest WT value (see Materials and Methods). WT and KO data are presented as box-plots; solid line within the box corresponds to the median; dashed line corresponds to the mean; edges of the box are the 25th and 75th percentiles; whiskers are the 10th and 90th percentiles; and open circles represent outliers. (E) Combined differential interference contrast and fluorescent images of villus tips show apoptotic cells (bright white regions) in WT and KO sections. Bars, 10 μm. Insets, TUNEL signal from the entire cross section (outlined with white dashed lines). Bars, 500 μm. (F) SEM of an enlarged and damaged villus in KO duodenum (see white dashed line). Bar, 500 μm.
Figure 9.
Figure 9.
(A) SDS-PAGE analysis of BBs isolated from WT and KO small intestine (loaded for equal total protein). Immunoblots confirm that the missing bands at ∼110 and ∼20 kDa correspond to Myo1a and its light chain, CaM. (B) Immunoblot screen of isolated BBs (loaded for equal total protein) reveals that several components are lost in KO, including Myo1e, Myo6, SI, and Gal4. CK8 and 18 are significantly elevated relative WT. (C) Immunoblots of whole cell homogenates show that total cellular levels of CaM, Myo1e, Myo6, and the cytokeratins (with WSCK) are no different in KO. SI and Gal4 were not readily detectable in these dilute fractions. (D) Immunostaining of KO duodenal sections shows the redistributions (relative to WT) of SI, Myo6, and the cytokeratins, but not AP. Bars, 10 μm.
Figure 7.
Figure 7.
TEM of WT (A–C) and KO (D–F) enterocytes reveals poor organization and loose packing of MV in the absence of Myo1a. TW disruptions are also obvious at higher magnification (compare B and E). Cross sections through WT (C) and KO (F) BBs show significant disarray in MV packing. (G) Mean packing angle (γ, see white dashed lines in C) measured from KO cross sections is significantly higher and more variable relative to WT (WT, 59.0 ± 8.0°, n = 280 vs. KO, 67.5 ± 16.8°, n = 286; *p < 0.0005). (H) Amount of free cross-sectional area (CSA) between the MV actin bundle and the apical membrane (calculated as MV CSA - actin core CSA) is significantly reduced in KO MV (WT, 7883 ± 834 nm2, n = 40 vs. KO, 5294 ± 579 nm2, n = 32; *p < 0.0005). (I) SD in MV length per cell is significantly greater in KO (WT, 4.1 ± 1.2%, n = 345 MV from 23 cells vs. KO, 10.0 ± 5.0%, n = 435 MV from 29 cells; *p < 0.0005). Data in H and I are presented as box-plots as described in the Figure 2 legend. Bars, 5 μm (A and D), 1 μm (B and E), and 200 nm (C and F).
Figure 3.
Figure 3.
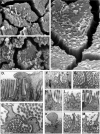
Low-magnification SEM of WT (A) and KO (B) villus surfaces. KO villus surfaces exhibit a general roughness due to irregularities in the apical membrane. Bars, 25 μm. The larger surface “cracks” apparent in these micrographs were formed as a result of the MV clumping that takes place during sample preparation (see Materials and Methods); they do not represent ultrastructural damage. Clumping enabled lateral views of microvilli at higher magnifications (see Figure 4). Insets show whole villi. Bars, 100 μm.
Figure 4.
Figure 4.
SEM of WT (A–C) and KO (D–F) enterocyte surfaces sampled at three positions along the gut axis: duodenum (A and D), ileum (B and E), and colon (C and F). Apical surface perturbations are confined to the small intestine (duodenum and ileum) in KO mice. Disarray in MV packing is evident in lateral views of KO BBs (compare arrowheads in A and D). Bars, 1 μm. Inset in A shows anti-Myo1a immunoblots on whole cell homogenates prepared from WT duodenum (D), ileum (I), or colon (C) and loaded for equal total protein.
Figure 5.
Figure 5.
SEM (A–C) and TEM (D–M) of apical membrane defects in KO enterocytes. Mild (A) and severe (B and C) cases of membrane extrusion from MV tips are shown. White asterisks (A) mark membrane extrusions that seem to emanate from individual MV. White brackets (C) denote larger herniations that seem to encompass multiple MV. Cross-sections obtained with TEM (D and E) show that larger membrane herniations are filled with cytosol; black arrowheads in E mark regions where actin core-apical membrane associations are retained. Other examples (F–M) demonstrate the diversity of apical membrane herniations observed in KO BBs. Bars, 1 μm (A–C) and 0.5 μm (D–M).
Figure 6.
Figure 6.
(A) Extensive vesiculation of BBs on multiple adjacent enterocytes (see black brackets). (B) Higher magnification reveals the sausage link appearance that is characteristic of villin-induced actin core severing (see white arrowheads). (C) SEM shows an en face view of an enterocyte with an extensively vesiculated BB. Bars, 2 μm (A), 250 nm (B), and 1 μm (C).

Comment in

Similar articles

Cited by

References

    1. Altman, D., Sweeney, H. L., and Spudich, J. A. (2004). The mechanism of myosin VI translocation and its load-induced anchoring. Cell 116, 737-749. - PubMed
    1. Berg, J. S., Powell, B. C., and Cheney, R. E. (2001). A millennial myosin census. Mol. Biol. Cell 12, 780-794. - PMC - PubMed
    1. Braccia, A., Villani, M., Immerdal, L., Niels-Christiansen, L. L., Nystrom, B. T., Hansen, G. H., and Danielsen, E. M. (2003). Microvillar membrane microdomains exist at physiological temperature. Role of galectin-4 as lipid raft stabilizer revealed by “superrafts.” J. Biol. Chem. 278, 15679-15684. - PubMed
    1. Brown, D. A., and London, E. (1998). Functions of lipid rafts in biological membranes. Annu. Rev. Cell Dev. Biol. 14, 111-136. - PubMed
    1. Burgess, D. R., and Prum, B. E. (1982). Reevaluation of brush border motility: calcium induces core filament solution and microvillar vesiculation. J. Cell Biol. 94, 97-107. - PMC - PubMed

Publication types