Comparative Study
. 2005 Mar 2;25(9):2233-44.
doi: 10.1523/JNEUROSCI.3032-04.2005.

Compartment-resolved imaging of activity-dependent dynamics of cortical blood volume and oximetry

Affiliations
Comparative Study

Compartment-resolved imaging of activity-dependent dynamics of cortical blood volume and oximetry

Ivo Vanzetta et al. J Neurosci. .

Abstract

Optical imaging, positron emission tomography, and functional magnetic resonance imaging (fMRI) all rely on vascular responses to image neuronal activity. Although these imaging techniques are used successfully for functional brain mapping, the detailed spatiotemporal dynamics of hemodynamic events in the various microvascular compartments have remained unknown. Here we used high-resolution optical imaging in area 18 of anesthetized cats to selectively explore sensory-evoked cerebral blood-volume (CBV) changes in the various cortical microvascular compartments. To avoid the confounding effects of hematocrit and oximetry changes, we developed and used a new fluorescent blood plasma tracer and combined these measurements with optical imaging of intrinsic signals at a near-isosbestic wavelength for hemoglobin (565 nm). The vascular response began at the arteriolar level, rapidly spreading toward capillaries and venules. Larger veins lagged behind. Capillaries exhibited clear blood-volume changes. Arterioles and arteries had the largest response, whereas the venous response was smallest. Information about compartment-specific oxygen tension dynamics was obtained in imaging sessions using 605 nm illumination, a wavelength known to reflect primarily oximetric changes, thus being more directly related to electrical activity than CBV changes. Those images were radically different: the response began at the parenchyma level, followed only later by the other microvascular compartments. These results have implications for the modeling of fMRI responses (e.g., the balloon model). Furthermore, functional maps obtained by imaging the capillary CBV response were similar but not identical to those obtained using the early oximetric signal, suggesting the presence of different regulatory mechanisms underlying these two hemodynamic processes.


Figures

Figure 4.
Figure 4.
Compartment-resolved time courses of the blood-volume changes in the cortical microvasculature. A, Fluorescence amplitude time course of the different microvascular compartments. B, Time course of the changes in reflection at 565 nm, resolved for the different microvascular compartments. Each curve in A and B represents the average over ∼20 samples of the same vascular compartment chosen from the images. To enhance timing relationships, C and D show the same data as A and B, respectively, but baseline-to-peak responses were normalized (norm.) before averaging. E and F redisplay the first 1.2 s of the responses shown in A and C. Here and in all other figures, the error bars represent 1 SD of the mean. Black, Arteries; red, arterioles; light green, parenchyma; cyan, venules; blue, veins.
Figure 5.
Figure 5.
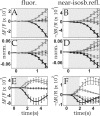
Differences between the compartment-resolved CBV time courses measured by fluorescence (fluor.) and near-isobestic reflection (near-isosb.refl.) in the cortical microvasculature. To emphasize intercompartmental differences, the curves were plotted after subtracting from each of them, for each time point, the mean vascular response (obtained by averaging over all compartments). A, Fluorescence amplitude time course of the different microvascular compartments. B, Time course of the changes in reflection at 565 nm. C and D are the same as A and B, respectively, but baseline-to-peak responses were normalized (norm.) before averaging. E, F, Non-normalized fluorescence and 565 nm reflection time courses, respectively, averaged over five experiments performed on three cats. Error bars represent 1 SD of the mean. Dashed lines, Arteries; thick gray lines, arterioles; thin gray lines, parenchyma; thin black lines, venules; thick black lines, veins.
Figure 8.
Figure 8.
Averaged functional maps; compartment-resolved oximetric changes. A, Differential map (vertical stimulus divided by horizontal one) averaged from 0.4 to 1.2 s after stimulus onset (highlighted white segment in D). Clipping range: 0.07%. Red and green crosses mark dark and bright patches to facilitate comparison between the single condition and the differential maps. B, C, Single-condition maps obtained by dividing the images obtained while a vertical (B) or horizontal (C) stimulus was presented by those obtained during a blank stimulus and averaged over the same time as in A. Clipping range: 0.05%. D, Initial decrease in the “global signal” time course (the initial dip), obtained by averaging the response over the entire image. The well known subsequent large overshoot resulting from the hyperoxygenation induced by the increased CBF is not shown here. E, F, Early time courses of reflected light at 605 nm, resolved for microvascular compartments. As in Figure 5, the mean time course (average over all compartments) was subtracted before display. E, Non-normalized display. F, After normalization (norm.) (same procedure as in Fig. 5). Dashed black lines, Arteries; thick gray lines, arterioles; thin gray lines, parenchyma; thin black lines, venules; thick black lines, veins.
Figure 9.
Figure 9.
Reproducibility of time courses with respect to the variability over different datasets. A, Reflection (R) signals at 605 nm. B, Fluorescence intensity (F). C, Reflection at 570 nm. To facilitate timing comparisons, the bottom panels display the graphs after normalizing (norm.) the peak amplitudes to [0,1]. Dashed black lines, Arteries; thick gray lines, arterioles; thin gray lines, parenchyma; thin black lines, venules; thick black lines, veins. The dashed gray line in all panels depicts the true “zero signal level,” which was omitted in Figures 5 and 8 for clarity of display. Note that because of the convention used in this display, relative to the zero-ordinate line, the dashed gray trace corresponds to the sign-inverted mean response (average over all compartments).
Figure 1.
Figure 1.
Visualization and identification of the different microvascular compartments. A, Image of the cortical surface taken with green light, maximizing the contrast of the vasculature and providing morphological information for identification of the blood vessels. B, Ratio of an image taken at 540 nm and one at 560 nm. This oximetric image aided the identification of the different vessel types based on their oxygen saturation level. White to black: veins, venules, arterioles, and arteries. Black and white arrowheads show examples of arterioles and venules, respectively. C, Fluorescent image of the cortex after injection of the dye. D, Enlarged view of the area indicated by the rectangle in C. Examples of arterioles are indicated by black arrowheads; venules are indicated by white arrowheads; the artery is indicated by a black dot; the vein is indicated by a white dot; parenchyma (i.e., mostly capillary network) are indicated by a white ellipse. E, Intensity profile of the reflection (R) at excitation wavelength (630 nm). A straight digital section through the image (F) was normalized by the mean over the segment [(R-<R>)/<R>]:black, before dye injection; gray, after the dye had reached a stationary distribution in the bloodstream. The different amplitudes of the two profiles show that, because of the absorption of the dye, the contrast of the blood vessels increased by a factor of ∼3 for vessels with a diameter of ∼100 μm and by a factor of >6 for vessels smaller than ∼50 μm. F, Image of the cortex taken at 630 nm; the dashed line shows the position of the intensity profile in E. The arrows relate the dips in the intensity profile in E to locations where the section crosses blood vessels. Scale bars: C, 0.5 mm; D, 0.2 mm.
Figure 2.
Figure 2.
Comparison of the signals recorded with different modalities. Time courses represent the signal averaged over the entire imaged area and were normalized to [0,1]; red, 570 nm imaged through a dichroic mirror (Dich.), 565 nm reflection (Refl.) signal; green, 570 nm reflection signal as recorded by the photodiode (P.D.) simultaneously with 565 nm imaging; magenta, fluorescence amplitude time course; blue, oximetry-corrected fluorescence time course (Corr.): the raw fluorescence was divided by the reflection signal at excitation wavelength (630 nm), recorded by the photodiode during fluorescence imaging. Inset, Reflection (R) signal at 630 nm, just after injection of the dye (solid), 4 h afterward (dotted line), and 14 h after injection (dashed line). The large difference between the solid curve and the dashed curve shows that for the data obtained <2 h after injection (Figs. 3, 4, 5, 6, 9, 10), the absorption caused by the dye was much larger than that caused by hemoglobin. Here and in all subsequent figures, the gray-shaded area marks the time during which the stimulus was presented.
Figure 3.
Figure 3.
Onset of stimulus-evoked blood-volume changes in the cortical microvasculature. Dynamic measurements by imaging fluorescence and reflected light at 565 nm are shown. A, Series of single-condition (horizontal gratings divided by blank) fluorescence images of ∼3 × 2 mm of cat visual cortex area 18. Brightening corresponds to increased fluorescence with respect to baseline. Range of grayscale used (“clipping range”): -0.12-0.55%. B, Same as A but reflection at 565 nm, instead of fluorescence. Here, the inverse color map was used (brightening corresponding to decreased reflection) to facilitate comparison with A; clipping range, -0.1-1.78%. Here and in Figures 6 and 7, the numbers on the top show the time (seconds after stimulus onset) at which each frame was acquired. The baseline image (averaged over 0.88 s before stimulus onset) was subtracted from all frames to eliminate slow, stimulus-unrelated vascular noise. The frames before 0.5 s (shown in Fig. 6) are not displayed here, because no activity pattern could be seen there.
Figure 6.
Figure 6.
Full dynamic range display of the CBV response; stimulus specificity of the arteriolar activation. A, Series of single-condition maps (stimuli: horizontal gratings divided by blank) obtained during fluorescence imaging. B, Same as A, but reflection at 565 nm was used instead of fluorescence (the grayscale was inverted for ease of comparison with A). The grayscale of each frame in A and B was centered on its mean value and stretched to ±3 SD over all pixels in the image. Clipping ranges: 0.04, 0.07, 0.1, 0.5, 2.7, 2.6% (A) and 0.1, 0.25, 0.46, 1.6, 6.0, 5.2% (B). Note that if any patterns are seen before arterioles become visible, they are unrelated between A and B (compare, for example, the second frame), thus suggesting vascular noise as their origin. C, D, Fluorescence response to horizontal and vertical gratings, respectively, averaged from 0.96 to 1.36 s after stimulus onset. E, F, Same as C and D, but reflection instead of fluorescence (color map was inverted). All arrowheads mark arterioles. Note the difference in activation (emphasized by the size of the arrowheads) of the arterioles marked by the black, white, and black-and-white arrowheads, depending on whether a horizontal or a vertical stimulus was presented (C vs D and E vs F). Clipping range (C-F): 0.50, 0.44, 1.63, 1.48%.
Figure 7.
Figure 7.
Single-condition maps, 605 nm reflection; first 4.5 s of the response. A, Series of single-condition (vertical vs blank) reflection images. B, Series of the “orthogonal” single-condition maps (horizontal vs blank). The grayscale of the maps in A and B was centered on the mean value of each image as in Figure 6 and stretched to ±1.5 SD. The baseline pattern (the average image from -0.8 s until stimulus onset) was subtracted from all images. In all images, the red and green crosses correspond to the location of the black and white functional patches, as obtained from the differential map in Figure 8A.
Figure 10.
Figure 10.
Comparison of differential maps recorded with different modalities. Top panels: A, Differential map (vertical/horizontal) obtained at 605 nm. Clipping range: 0.08%. B, Differential map obtained with fluorescence imaging (color map in B was inverted to facilitate comparison with the other panels). Clipping range: 0.31%. C, Differential map obtained at 565 nm. Clipping range: 0.7%. Although the image in A was averaged only from 0.4 to 1.2 s, B and C were averaged for the duration of the CBV response (∼8 s). D, E, Differential maps (vertical/horizontal) obtained at 605 and 570 nm from another cat. Clipping range: 0.07 and 0.27%, respectively. Arrows in E indicate two examples of stimulus-specific activated arterioles. Bottom panels: Same as top panels, but Gaussian (σ ∼100 μm) low-pass filtered to enhance the functional patches over the vascular patterns. As shown by the pseudocolor display, the crosses marking dark and bright patches were deduced from maxima and minima of the oximetric maps (A, D, bottom) and transposed to the identical locations in the other panels to facilitate comparison between the maps. Scale bars, 0.5 mm.

Similar articles

Cited by

References

    1. Ances BM, Buerk DG, Greenberg JH, Detre JA (2001) Temporal dynamics of the partial pressure of brain tissue oxygen during functional forepaw stimulation in rats. Neurosci Lett 306: 106-110. - PubMed
    1. Bonhoeffer T, Grinvald A (1991) Iso-orientation domains in cat visual cortex are arranged in pinwheel-like patterns. Nature 353: 429-431. - PubMed
    1. Bonhoeffer T, Grinvald A (1993) The layout of iso-orientation domains in area 18 of cat visual cortex: optical imaging reveals a pinwheel-like organization. J Neurosci 13: 4157-4180. - PMC - PubMed
    1. Bosking WH, Zhang Y, Schofield B, Fitzpatrick D (1997) Orientation selectivity and the arrangement of horizontal connections in tree shrew striate cortex. J Neurosci 17: 2112-2127. - PMC - PubMed
    1. Buxton RB, Frank LR (1997) A model for the coupling between cerebral blood flow and oxygen metabolism during neural stimulation. J Cereb Blood Flow Metab 17: 64-72. - PubMed

Publication types