. 2005 Feb 9;25(6):1354-65.
doi: 10.1523/JNEUROSCI.3034-04.2005.

Myelinogenesis and axonal recognition by oligodendrocytes in brain are uncoupled in Olig1-null mice

Affiliations

Myelinogenesis and axonal recognition by oligodendrocytes in brain are uncoupled in Olig1-null mice

Mei Xin et al. J Neurosci. .

Abstract

Myelin-forming oligodendrocytes facilitate saltatory nerve conduction and support neuronal functions in the mammalian CNS. Although the processes of oligodendrogliogenesis and differentiation from neural progenitor cells have come to light in recent years, the molecular mechanisms underlying oligodendrocyte myelinogenesis are poorly defined. Herein, we demonstrate the pivotal role of the basic helix-loop-helix transcription factor, Olig1, in oligodendrocyte myelinogenesis in brain development. Mice lacking a functional Olig1 gene develop severe neurological deficits and die in the third postnatal week. In the brains of these mice, expression of myelin-specific genes is abolished, whereas the formation of oligodendrocyte progenitors is not affected. Furthermore, multilamellar wrapping of myelin membranes around axons does not occur, despite recognition and contact of axons by oligodendrocytes, and Olig1-null mice develop widespread progressive axonal degeneration and gliosis. In contrast, myelin sheaths are formed in the spinal cord, although the extent of myelination is severely reduced. At the molecular level, we find that Olig1 regulates transcription of the major myelin-specific genes, Mbp, Plp1, and Mag, and suppresses expression of a major astrocyte-specific gene, Gfap. Together, our data indicate that Olig1 is a central regulator of oligodendrocyte myelinogenesis in brain and that axonal recognition and myelination by oligodendrocytes are separable processes.


Figures

Figure 1.
Figure 1.
Targeted mutation of the Olig1 gene and phenotypes of Olig1-null mice. A, Schematic for FLPase-mediated removal of the PGKneo cassette through breeding with FLPeR (Flipper) mice. PGKneo, Neomycin gene driven by the PGK promoter. B, The lifespan of Olig1-null (-/-) mice (46 mice tested) ranges from P13 to P17, which is an active period of oligodendrocyte myelination. All Olig1 heterozygotes (+/-) (95 mice tested) have a normal lifespan, as do their wild-type littermates. C, Olig1-null mice exhibit abnormal clasping of all limbs and are motionless when held upside down, compared with age-matched littermates, which are active and extend their limbs. DTA, Diphtheria toxin.
Figure 2.
Figure 2.
Myelin deficits in Olig1-null mice. A, Expression of myelin genes analyzed by in situ hybridization using probes to Olig1, Mbp, and Plp1/Dm-20 and immunocytochemistry using anti-CNP antibodies on frozen sections of P14 brains from Olig1-heterozygous (+/-) or -null (-/-) mice. Expression of Mbp, Plp1/Dm-20, and CNP is evident in white matter tracts (arrows) of +/- but not -/- mice. B, In situ hybridization signals for mature oligodendrocyte markers, NogoA and Omgp, are absent in -/- mice (black arrows); however, expression in neurons is unaffected (red arrowheads). C, Myelin lipid deposition around axons is detected using Gallyas silver staining in white matter tracts of +/- mice (left column; arrows) but not -/- mice (right column). Coronal and parasagittal sections of forebrain and cerebellum are shown. Ctx, Cortex; cc, corpus callosum; St, striatum.
Figure 3.
Figure 3.
Myelin sheath assembly in optic nerves from Olig1-null mice. A, Optic nerves from Olig1-heterozygous (+/-) mice at P14 are white because of myelinated axons, whereas optic nerves from Olig1-null (-/-) littermates are translucent. B, Approximately 35% of axons in +/+ and +/- mice are myelinated at P14 (number of axons scored, 800). In contrast, optic nerve axons in Olig1-null (-/-) mice are unmyelinated. C, Electron micrographs of optic nerves in cross sections from +/- mice at P14. Multilamellar myelin sheaths are apparent around many axons. The right panel is shown at higher power (arrow). D, Electron micrographs of optic nerves in cross section from -/- mice at P14. All axons in optic nerves are unmyelinated (red arrow). A large number of intermediate filament-containing astrocytic processes are indicative of gliosis (blue arrows). The right panel is shown at high magnification. E, F, In situ hybridization of PdgfαR and immunohistochemical labeling of CC-1 in optic nerves at P14. PdgfαR+ OPCs (E, arrows) are detected in +/- and -/- mice, but very few CC1+ oligodendrocytes (F, arrows) are observed in -/- mice. G, Electron micrographs of corpus callosum in cross section from +/- and -/- mice at P14. The absence of multilamellar myelin (red arrows) in -/- mice is apparent in the right panel. Scale bars: C, D, left panels, 2 μm; right panels, 500 nm; G, 500 nm.
Figure 4.
Figure 4.
Axon recognition by oligodendrocytes in optic nerves and axonal degeneration in Olig1-null mutants. A-C, Intermediate filament-negative oligodendrocyte processes (arrows) contact (A) and begin to encircle (B, C) axons (A). Formation of a multilayer membrane flap (C, arrow) near an axon is also observed. These ultrastructural analyses indicate that oligodendrocytes recognize axons and begin the process of ensheathment in Olig1-null (-/-) mice. D, Myelin figures (arrows) within optic nerve axons from -/- mice. E, Axonal swellings and degenerating axons (arrows) are observed in optic nerves of -/- mice. F, High-power view of a degenerating axon (arrow) shown in E showing fragmented cellular organelles and mitochondria. Scale bars, 500 nm.
Figure 5.
Figure 5.
Oligodendrocyte development in postnatal brain. A, In situ hybridization of PdgfαR shows similar expression levels in cortical regions of Olig1- heterozygotous (+/-) and -null (-/-) mice, but expression in white matter tracts is reduced in -/- mice (arrowheads). Middle and right panels are higher-power views of the left column (20×) and show white matter and cortex, respectively. B, Coronal sections of forebrain from +/- and -/- mice at P14 immunostained with anti-NG2 antibody. The number and morphology of NG2+ cells in the brains of -/- mice are comparable with +/- mice. Panels in the right column are higher-power views of NG2+ cells (arrows). C, In situ hybridization of Olig2 is similar in cortex of +/- and -/- mice, but expression in white matter is reduced in -/- mice (arrowheads). Middle and right panels are higher-power views (20×) showing the external capsule and corpus callosum (cc), respectively. D, Parasagittal brain sections of +/- and -/- mice at P11 immunolabeled with anti-O4 antibody. Intense labeling of mature oligodendrocytes is observed in corpus callosum from +/- mice (top right panel and inset). The numbers of O4+ cells in -/- and +/- cortex are comparable. Many O4+ cells from -/- mice are located at the corpus callosum-cortex boundary (blue arrows); however, these cells are reduced in white matter tracts (bottom panels). Furthermore, O4+ cells in -/- mice exhibit a multipolar ramified morphology (inset in bottom right panel) and fail to ensheath axons. E, Sagittal sections of +/- and -/- cortex at P11 immunolabeled with anti-Cre antibody. The numbers of Cre+ cells (green) from -/- (bottom right panel) and +/- (top right panels) mice are comparable but are reduced in -/- corpus callosum (bottom left panel) compared with +/- (top left panel, arrows). F, Cortical sections from -/- mice at P11 immunolabeled with anti-Cre (red) and anti-NG2 (green, bottom panel) antibodies show colocalization of both antigens (arrows).
Figure 6.
Figure 6.
Oligodendrocyte differentiation in cortical progenitor cell in vitro cultures. A, Cortical cells from P2 Olig1-heterozygous (+/-) and -null (-/-) pups cultured invitro to assess their differentiation potential. Immunolabeling of cultures shows web-like multipolar CNP+ (red) and Cre+ (green) oligodendrocytes (arrowheads) from +/- and -/- mice. B, Cortical OPCs from +/- pups differentiate and express MBP (red, left column, arrowheads); however, few MBP+ oligodendrocytes (arrowheads) are generated from -/- mice (right column). C, Bar graph (mean ± SD) showing comparable numbers of CNP+ oligodendrocytes generated from +/- and -/- cultures and a 20-fold reduction in MBP+ oligodendrocytes from -/- cultures. D, Cortical OPCs from E18.5 Olig2 +/- and -/- embryos cultured to assess their differentiation potential. Cells in -/- cultures fail to express Olig2 (green) or CNP; however, cells from +/- cultures generate Olig2+, CNP+ oligodendrocytes (red). E, Induction of Mbp- but not Gfap-promoter constructs in transiently transfected cells expressing Olig1. Transfection efficiency is normalized using β-galactosidase activity from a cotransfected reporter construct.
Figure 7.
Figure 7.
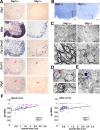
Oligodendrocyte myelination in spinal cord from Olig1-null mice. A, In situ hybridization of Olig1, Mbp, Plp1, Sox10, and Olig2 analyzed in frozen sections from Olig1-heterozygous (+/-) and -null (-/-) mice at P14. Mbp, Plp1, Sox10, and Olig2 are strongly expressed in spinal cord from +/- mice but only weakly expressed in -/- mutants (arrowheads). Olig2- and Sox10-expressing cells are found in gray matter from -/- mice (arrows). B, Spinal cords from +/- and -/- mice stained with toluidine blue dye to visualize white and gray matter regions. White matter thickness is significantly reduced in -/- (right panel) compared with +/- (left panel) sections (square brackets). C, Electron micrographs show fewer myelinated axons in -/- mice compared with +/- mice. Bottom panels show high-power views. Myelin sheaths from -/- mice are thinner compared with littermate controls (arrows). Degenerating axons are also detected in these mice (arrowheads). D, Abnormal splitting of myelins heaths (top panel, arrows) and Wallerian myelin degeneration (bottom panel) from -/- mice. E, Vesicle and organelle inclusions in degenerating axons from -/- mice (arrowheads). F, Scatter plots showing g-ratios as a function of axon diameter for spinal cord (left panel) and optic nerve (right panel) in +/- (blue symbols) and -/- (purple symbols) mice. Scale bars: B, 50 μm; C, top panels, 10 μm; C, bottom panels, 2 μm; D, E, 500 nm.
Figure 8.
Figure 8.
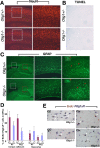
Neuronal development in brain from Olig1-null mice. A, NeuN expression in coronal sections of cortex from Olig1-heterozygous (+/-) and -null (-/-) mice at P14 to examine neuronal development. White-boxed areas in left panels are shown at higher power (20×) in the right panels. Neurogenesis and lamination are comparable in +/- and -/- mice. B, TUNEL of coronal sections from cortex indicates that there are few apoptotic cells in +/- and -/- mice. C, Astrocyte development examined in parasagittal brain sections using GFAP immunocytochemistry. White-boxed (corpus callosum) and red-boxed (hippocampus) areas (left panels) are shown at higher power (20×) in middle and right panels, respectively. GFAP+-reactive astrocytes (arrows) from -/- mice exhibit large cell bodies and bulky processes (bottom inset); however, astrocytes (arrows) from control mice have thin processes and relatively small cell bodies (top inset). D, The numbers of cycling cells in brain measured by double in situ hybridization and immunohistochemistry 4 h after BrdU administration to animals at P7 and P12. The proportion of PdgfαR+ OPCs in the cell cycle at the time of the BrdU injections in cortex is comparable between +/- and -/- mice but reduced in white matter from the null mutants. E, Examples of BrdU+/PdgfαR+ cells (arrowheads) are shown in the white matter and the cortex of Olig1 +/+ and -/- mice. CC, Corpus callosum; Ctx, cortex.
Figure 9.
Figure 9.
Major roles of Olig1 and Olig2 during oligodendrocyte maturation in brain. Oligodendrocyte maturation involves the progression of cells through a series of defined developmental stages including OPCs, immature OLs, differentiated premyelinating OLs, and mature myelinating OLs. Olig2 is essential for initiation of oligodendrogliogenesis from neural progenitor cells and the formation of immature OLs. Olig1 is critical for the appearance of myelinating OLs in developing brain, and there are likely to be spatiotemporally specific and nonredundant roles of bHLH proteins Olig1 and Olig2 in oligodendrocyte development. At present, the requirement of Olig2 for oligodendrocyte myelination in brain cannot be assessed formally. NPC, Neural progenitor cell.

Similar articles

Cited by

References

    1. Barres BA, Raff MC (1994) Control of oligodendrocyte number in the developing rat optic nerve. Neuron 12: 935-942. - PubMed
    1. Barres BA, Schmid R, Sendnter M, Raff MC (1993) Multiple extracellular signals are required for long-term oligodendrocyte survival. Development 118: 283-295. - PubMed
    1. Barres BA, Lazar MA, Raff MC (1994) A novel role for thyroid hormone, glucocorticoids and retinoic acid in timing oligodendrocyte development. Development 120: 1097-1108. - PubMed
    1. Berger J, Moser HW, Forss-Petter S (2001) Leukodystrophies: recent developments in genetics, molecular biology, pathogenesis and treatment. Curr Opin Neurol 14: 305-312. - PubMed
    1. Bhat RV, Axt KJ, Fosnaugh JS, Smith KJ, Johnson KA, Hill DE, Kinzler KW, Baraban JM (1996) Expression of the APC tumor suppressor protein in oligodendroglia. Glia 17: 169-174. - PubMed

Publication types

MeSH terms