

Force mapping in epithelial cell migration
- PMID: 15695588
- PMCID: PMC548966
- DOI: 10.1073/pnas.0408482102
Force mapping in epithelial cell migration
Erratum in
- Proc Natl Acad Sci U S A. 2005 Sep 27;102(39):14122. Siberzan, Pascal [corrected to Silberzan, Pascal]
Abstract
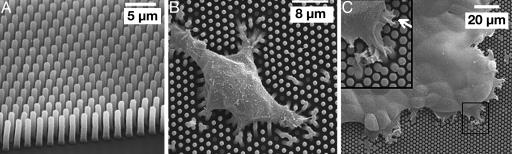
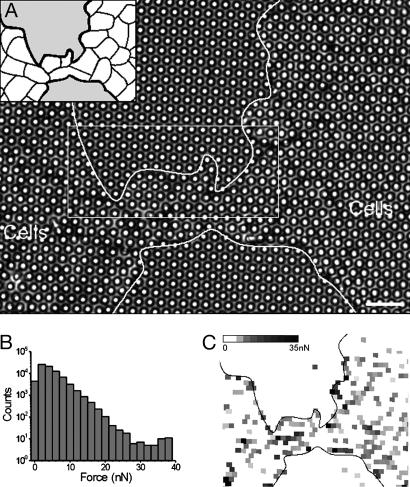
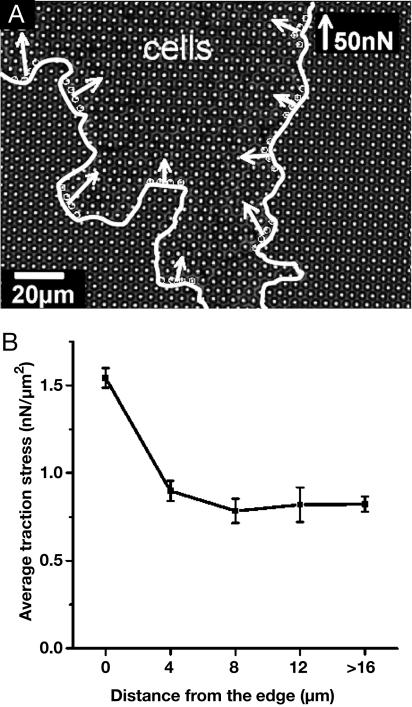
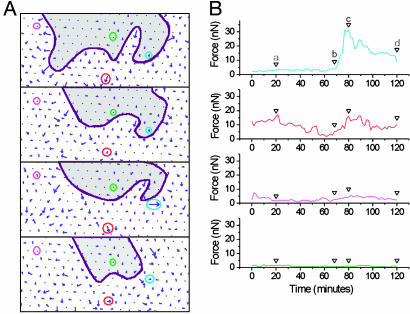
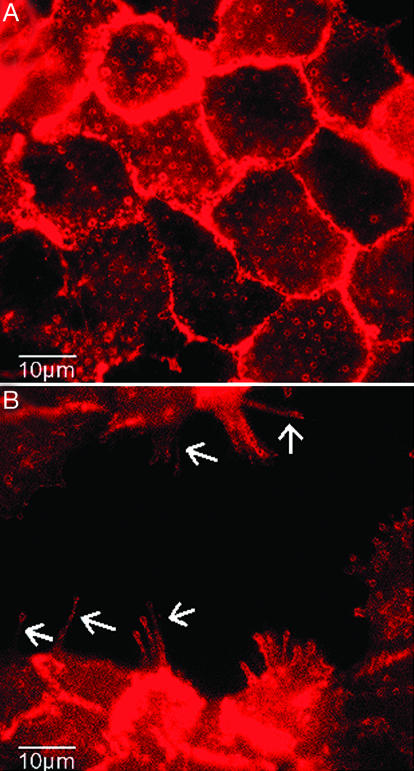
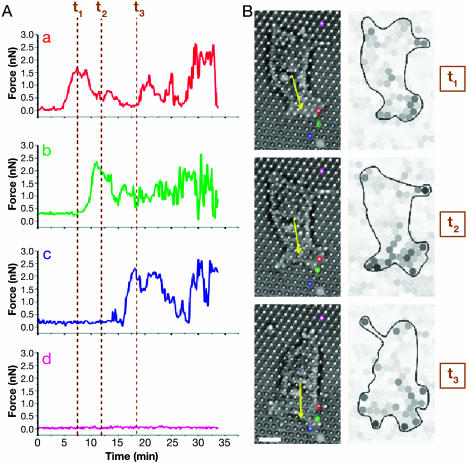
We measure dynamic traction forces exerted by epithelial cells on a substrate. The force sensor is a high-density array of elastomeric microfabricated pillars that support the cells. Traction forces induced by cell migration are deduced from the measurement of the bending of these pillars and are correlated with actin localization by fluorescence microscopy. We use a multiple-particle tracking method to estimate the mechanical activity of cells in real time with a high-spatial resolution (down to 2 microm) imposed by the periodicity of the post array. For these experiments, we use differentiated Madin-Darby canine kidney (MDCK) epithelial cells. Our data provide definite information on mechanical forces exerted by a cellular assembly. The maximum intensity of the forces is localized on the edge of the epithelia. Hepatocyte growth factor promotes cell motility and induces strong scattering activity of MDCK cells. Thus, we compare forces generated by MDCK cells in subconfluent epithelia versus isolated cells after hepatocyte growth factor treatment. Maximal-traction stresses at the edge of a monolayer correspond to higher values than those measured for a single cell and may be due to a collective behavior.
Figures
Similar articles
-
Hepatocyte growth factor and Madin-Darby canine kidney cells: in vitro models of epithelial cell movement and morphogenesis.Microsc Res Tech. 1998 Dec 1;43(5):456-63. doi: 10.1002/(SICI)1097-0029(19981201)43:5<456::AID-JEMT11>3.0.CO;2-2. Microsc Res Tech. 1998. PMID: 9858342
-
[An array of microfabricated pillars to study cell migration].Med Sci (Paris). 2005 Aug-Sep;21(8-9):765-7. doi: 10.1051/medsci/2005218-9765. Med Sci (Paris). 2005. PMID: 16115464 French.
-
Traction forces exerted by epithelial cell sheets.J Phys Condens Matter. 2010 May 19;22(19):194119. doi: 10.1088/0953-8984/22/19/194119. Epub 2010 Apr 26. J Phys Condens Matter. 2010. PMID: 21386442
-
Plasticity of renal epithelial cells: the way a potassium channel supports migration.Pflugers Arch. 1996;432(3 Suppl):R87-93. Pflugers Arch. 1996. PMID: 8994548 Review.
-
Traction force microscopy in physics and biology.Soft Matter. 2014 Jun 21;10(23):4047-55. doi: 10.1039/c4sm00264d. Soft Matter. 2014. PMID: 24740485 Review.
Cited by
-
Mechanobiology in lung epithelial cells: measurements, perturbations, and responses.Compr Physiol. 2012 Jan;2(1):1-29. doi: 10.1002/cphy.c100090. Compr Physiol. 2012. PMID: 23728969 Free PMC article. Review.
-
Computational modeling of single-cell migration: the leading role of extracellular matrix fibers.Biophys J. 2012 Sep 19;103(6):1141-51. doi: 10.1016/j.bpj.2012.07.048. Biophys J. 2012. PMID: 22995486 Free PMC article.
-
Biomechanics of Collective Cell Migration in Cancer Progression: Experimental and Computational Methods.ACS Biomater Sci Eng. 2019;5(8):3766-3787. doi: 10.1021/acsbiomaterials.8b01428. Epub 2019 May 22. ACS Biomater Sci Eng. 2019. PMID: 32953985 Free PMC article.
-
Silica-Coated Magnetic Nanoparticles Decrease Human Bone Marrow-Derived Mesenchymal Stem Cell Migratory Activity by Reducing Membrane Fluidity and Impairing Focal Adhesion.Nanomaterials (Basel). 2019 Oct 17;9(10):1475. doi: 10.3390/nano9101475. Nanomaterials (Basel). 2019. PMID: 31627375 Free PMC article.
-
Propagation of mechanical stress through the actin cytoskeleton toward focal adhesions: model and experiment.Biophys J. 2008 Feb 15;94(4):1470-82. doi: 10.1529/biophysj.107.108688. Epub 2007 Oct 12. Biophys J. 2008. PMID: 17933882 Free PMC article.
References
Publication types
MeSH terms
Substances
LinkOut - more resources
Full Text Sources
Other Literature Sources
