. 2005 Feb 9;24(3):533-42.
doi: 10.1038/sj.emboj.7600553. Epub 2005 Feb 3.

Central role of Ifh1p-Fhl1p interaction in the synthesis of yeast ribosomal proteins

Affiliations

Central role of Ifh1p-Fhl1p interaction in the synthesis of yeast ribosomal proteins

Dipayan Rudra et al. EMBO J. .

Abstract

The 138 genes encoding the 79 ribosomal proteins (RPs) of Saccharomyces cerevisiae form the tightest cluster of coordinately regulated genes in nearly all transcriptome experiments. The basis for this observation remains unknown. We now provide evidence that two factors, Fhl1p and Ifh1p, are key players in the transcription of RP genes. Both are found at transcribing RP genes in vivo. Ifh1p, but not Fhl1p, leaves the RP genes when transcription is repressed. The occupancy of the RP genes by Ifh1p depends on its interaction with the phospho-peptide recognizing forkhead-associated domain of Fhl1p. Disruption of this interaction is severely deleterious to ribosome synthesis and cell growth. Loss of functional Fhl1p leads to cells that have only 20% the normal amount of RNA and that synthesize ribosomes at only 5-10% the normal rate. Homeostatic mechanisms within the cell respond by reducing the transcription of rRNA to match the output of RPs, and by reducing the global transcription of mRNA to match the capacity of the translational apparatus.


Figures
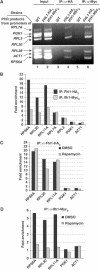
Figure 1
Figure 1
Fhl1p and Ifh1p are associated with RP gene promoters. (A) ChIP was performed using anti-HA or anti-Myc antibodies on W303a (WT) and DR36 (FHL1-HA3, IFH1-MYC9) double-tagged strains. Following IP, PCR was performed on total chromatin (input) and the immunoprecipitated (IP) DNA with primers specific for the promoters of the indicated RP genes. Primers specific for the promoters of non-RP genes PGK1 and ACT1 were used as controls. (B) A real-time PCR performed on the samples from strain DR36 (FHL1-HA3, IFH1-MYC9) in (A) using primers for the promoters of the indicated genes. Calculation of the ‘fold enrichment' values is documented in Materials and methods. (C, D) FHL1-HA3, IFH1-MYC9 (strain DR47) double-tagged cells were pretreated for 30 min with rapamycin or the drug vehicle DMSO prior to formaldehyde crosslinking. This was followed by ChIP using anti-HA (C) or anti-Myc (D) antibodies followed by real-time PCR analysis.
Figure 2
Figure 2
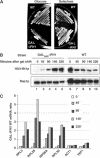
Ifh1p as a regulator of RP genes. (A) Growth of YZ146 (IFH1-HA3 (WT)) and YZ147 (GALUAS-HA3-IFH1) in glucose (YPD) and galactose (YPGal) respectively. Cultures of WT (YZ146) and GALUAS-HA3-IFH1(YZ147) cells were grown in YPD media, and were shifted to YPGal by filtering. Cells were harvested at the indicated time points. (B) A portion was prepared for Western analysis using antibodies directed against the HA epitope or against Rap1p. (C) From the rest, RNA was prepared and Northern analysis was performed to determine the level of the indicated mRNAs by normalizing with the U3 snoRNA. A graphical representation of the ratio (GAL-IFH1/WT) at each time point is shown. Note that the total RNA level of these cells when grown in glucose is only 1/5 that of WT cells. As will be discussed below (Figures 7 and 8), limiting availability of Ifh1p leads to a downregulation of total RNA as well as of all mRNAs to match the availability of the translational apparatus. The levels of U3 snoRNA remain relatively constant. Thus when normalized against U3 snoRNA, at the 0 time points the ratio of both RP and non-RP mRNAs in mutant versus WT cells in glucose medium is approximately 0.2.
Figure 3
Figure 3
Failure of Fhl1p and Ifh1p to bind an RP promoter. A radiolabeled PCR-amplified fragment encompassing the intergenic region between RPL11A and PRE2 (1 ng) was mixed with partially purified TAP-tagged Rap1p (5–10 ng), Fhl1p and Ifh1p (50–100 ng), or mock-purified product from an untagged strain, either separately or together as indicated in the figure, for 60 min at 0°C in 20 μl of solution containing 20 mM Tris–HCl (pH 7.5), 50 mM NaCl, 2 mM MgCl2, 0.5 mM DTT, 5% glycerol, 5 μg poly(dI-dC), 20 μg BSA and 2 mM PMSF. Nondenaturing polyacrylamide gel electrophoresis on 8% acrylamide gels run in 25 mM Tris–borate and 0.25 mM EDTA to resolve any DNA–protein complex formed was followed by autoradiography of the dried gel.
Figure 4
Figure 4
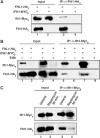
Fhl1p and Ifh1p interact with each other. (A) Co-IP was carried out using anti-HA antibody on extracts prepared from DR36 (FHL1-HA3, IFH1-MYC9 double-tagged), with DR37 (IFH1-MYC9) as a negative control. The immunoprecipitated protein complex was resuspended in SDS loading buffer, boiled and analyzed by SDS–PAGE followed by Western blotting using anti-HA or anti-Myc antibodies. A 5 μl portion of the original cell extracts was analyzed in separate lanes as loading controls (input). (B) A converse Co-IP experiment to Figure 2A. In this case, the IP was carried out using anti-Myc antibody on extracts prepared from DR36 (FHL1-HA3, IFH1-MYC9), with DR13 (FHL1-HA3) as a negative control. Samples in the lanes indicated were treated with 200 μg/ml of ethidium bromide for 30 min on ice before the IP (see Materials and methods). (C) Extracts of DR36 (FHL1-HA3, IFH1-MYC9) cells that had been treated with 0.2 μg/ml rapamycin or with drug vehicle (DMSO) for 30 min were subjected to Co-IP using anti-Myc antibody.
Figure 5
Figure 5
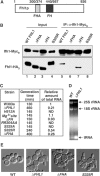
The FHA domain of Fhl1p is required for its interaction with Ifh1p. (A) Schematic of the Fhl1p protein with the FHA domain (amino acids 300–374) and the FH domain (amino acids 440–567) indicated. (B) Co-IP using anti-Myc antibody on extracts prepared from equal numbers of cells of strains DR47 (FHL1-HA3), DR48 (ΔFH-HA3) or DR49 (ΔFHA-HA3), carried on a CEN plasmid, covering the deleted FHL1; Ifh1p is tagged C-terminally with Myc9. (C) Cultures were grown in synthetic media at 30°C with gentle shaking and the growth rate determined over several generations by light scattering at 600 nm. The mutations in FHL1 are indicated. The Mg2+ site mutant consisted of the following changes: L514A, S515A, N517A and F520A. Deletion of the FH domain includes amino acids 440–567 and that of the FHA domain includes amino acids 300–374. The total RNA isolated from 1 ml of a culture of W303a at OD600∼1.0 is arbitrarily defined as 1 unit. The relative amount of RNA from the indicated strains at a similar optical density is tabulated. ND: not done. (D) A 7.5 μg portion of RNA isolated from the indicated strains (requiring 5 × as many mutant as WT cells) was mixed with ethidium bromide and analyzed on a denaturing agarose gel and photographed under UV illumination. (E) WT and FHL1 mutant strains viewed at 100 × magnification with Nomarski optics.
Figure 6
Figure 6
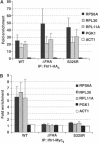
Interaction of Fhl1p and Ifh1p is necessary to bring Ifh1p to the RP genes. A ChIP experiment followed by real-time PCR was performed using anti-HA (A) or anti-Myc (B) antibodies on strains harboring HA3-tagged full-length (WT), FHA domain deleted (ΔFHA) or the S325R mutant version of Fhl1p (strains DR47, DR49 and DR65, respectively). The endogenous copy of FHL1 in these strains is deleted, and Ifh1p is tagged C-terminally with Myc9.
Figure 7
Figure 7
Slow transcription and processing of rRNA in mutant cells. Cultures of YNN281(WT), SHY35 (ΔFHL1) and D-105 (ΔFHL1 ΔIFH1), growing in methionine drop-out medium, were pulsed with [C3H3]-methionine (Perkin-Elmer NET061-X) at 60 μCi/ml for 2.5 min (A–C) or 10 min (D, E). Cold methionine was added to 100 μg/ml and samples were taken at the indicated times. RNA was prepared and analyzed on a denaturing gel, transferred to nylon and treated with En3Hance (Perkin-Elmer) and subjected to autoradiography for 7 days at −80. (Note that the WT lanes were loaded with RNA from half as many cells as the others.)
Figure 8
Figure 8
mRNA levels of ΔFHL1 and ΔFHL1, ΔIFH1 mutant strains. (A) Northern analysis showing the levels of RP mRNAs when normalized by U3 snoRNA or by ACT1. Total RNA (7.5 μg) was analyzed on denaturing agarose gels, transferred to nylon membrane and analyzed using labeled oligonucleotide probes directed against the indicated RNA species as previously described (Nierras and Warner, 1999). (B–G) Graphical representation of differential gene expression comparing DR36 (WT) with itself (B), with DR34 (ΔFHL1) (D) and with DR35 (ΔFHL1 ΔIFH1) (F). The differential expressions of only the RP genes for the above samples are shown in (C, E and G), respectively. RNA from DR36, DR34 and DR35 strains was analyzed in duplicate using individual Affymetrix S98 arrays. The robust multiarray average (RMA) algorithm was used to normalize all six arrays and to compute average gene expression values for each strain. The original data are available in Supplementary Table I.
Figure 9
Figure 9
Rapamycin causes repression of RP genes in cells lacking Fhl1p and Ifh1p. Strains DR34, DR47, DR48, DR49, DR65 and DR35 were treated with rapamycin (0.2 μg/ml) and harvested at indicated time points. Total RNA was isolated, and 7.5 μg of RNA was analyzed by Northern blotting as described for Figure 8. Note the consistent high levels of U3 RNA from strains deficient in functional Fhl1p.

Similar articles

Cited by

References

    1. Angus-Hill ML, Schlichter A, Roberts D, Erdjument-Bromage H, Tempst P, Cairns BR (2001) A Rsc3/Rsc30 zinc cluster dimer reveals novel roles for the chromatin remodeler RSC in gene expression and cell cycle control. Mol Cell 7: 741–751 - PubMed
    1. Beer MA, Tavazoie S (2004) Predicting gene expression from sequence. Cell 117: 185–198 - PubMed
    1. Bernstein BE, Liu CL, Humphrey EL, Perlstein EO, Schreiber SL (2004) Global nucleosome occupancy in yeast. Genome Biol 5: R62. - PMC - PubMed
    1. Cardenas ME, Cutler NS, Lorenz MC, Di Como CJ, Heitman J (1999) The TOR signaling cascade regulates gene expression in response to nutrients. Genes Dev 13: 3271–3279 - PMC - PubMed
    1. Causton HC, Ren B, Koh SS, Harbison CT, Kanin E, Jennings EG, Lee TI, True HL, Lander ES, Young RA (2001) Remodeling of yeast genome expression in response to environmental changes. Mol Biol Cell 12: 323–337 - PMC - PubMed

Publication types

MeSH terms