The profile of repeat-associated histone lysine methylation states in the mouse epigenome
- PMID: 15678104
- PMCID: PMC549616
- DOI: 10.1038/sj.emboj.7600545
The profile of repeat-associated histone lysine methylation states in the mouse epigenome
Abstract
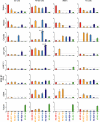
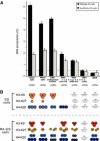
Histone lysine methylation has been shown to index silenced chromatin regions at, for example, pericentric heterochromatin or of the inactive X chromosome. Here, we examined the distribution of repressive histone lysine methylation states over the entire family of DNA repeats in the mouse genome. Using chromatin immunoprecipitation in a cluster analysis representing repetitive elements, our data demonstrate the selective enrichment of distinct H3-K9, H3-K27 and H4-K20 methylation marks across tandem repeats (e.g. major and minor satellites), DNA transposons, retrotransposons, long interspersed nucleotide elements and short interspersed nucleotide elements. Tandem repeats, but not the other repetitive elements, give rise to double-stranded (ds) RNAs that are further elevated in embryonic stem (ES) cells lacking the H3-K9-specific Suv39h histone methyltransferases. Importantly, although H3-K9 tri- and H4-K20 trimethylation appear stable at the satellite repeats, many of the other repeat-associated repressive marks vary in chromatin of differentiated ES cells or of embryonic trophoblasts and fibroblasts. Our data define a profile of repressive histone lysine methylation states for the repetitive complement of four distinct mouse epigenomes and suggest tandem repeats and dsRNA as primary triggers for more stable chromatin imprints.
Figures


Similar articles
-
Suv39h-mediated histone H3 lysine 9 methylation directs DNA methylation to major satellite repeats at pericentric heterochromatin.Curr Biol. 2003 Jul 15;13(14):1192-200. doi: 10.1016/s0960-9822(03)00432-9. Curr Biol. 2003. PMID: 12867029
-
Histone lysine trimethylation exhibits a distinct perinuclear distribution in Plzf-expressing spermatogonia.Dev Biol. 2006 May 15;293(2):461-72. doi: 10.1016/j.ydbio.2006.02.013. Epub 2006 Mar 20. Dev Biol. 2006. PMID: 16549060
-
Distinct dynamics and distribution of histone methyl-lysine derivatives in mouse development.Dev Biol. 2004 Dec 15;276(2):337-51. doi: 10.1016/j.ydbio.2004.08.038. Dev Biol. 2004. PMID: 15581869
-
Chromatin-based silencing mechanisms.Curr Opin Plant Biol. 2004 Oct;7(5):521-6. doi: 10.1016/j.pbi.2004.07.003. Curr Opin Plant Biol. 2004. PMID: 15337094 Review.
-
The indexing potential of histone lysine methylation.Novartis Found Symp. 2004;259:22-37; discussion 37-47, 163-9. Novartis Found Symp. 2004. PMID: 15171245 Review.
Cited by
-
High-resolution enzymatic mapping of genomic 5-hydroxymethylcytosine in mouse embryonic stem cells.Cell Rep. 2013 Feb 21;3(2):567-76. doi: 10.1016/j.celrep.2013.01.001. Epub 2013 Jan 24. Cell Rep. 2013. PMID: 23352666 Free PMC article.
-
p53 promotes repair of heterochromatin DNA by regulating JMJD2b and SUV39H1 expression.Oncogene. 2014 Feb 6;33(6):734-44. doi: 10.1038/onc.2013.6. Epub 2013 Feb 4. Oncogene. 2014. PMID: 23376847 Free PMC article.
-
Extensive methylation of promoter sequences silences lentiviral transgene expression during stem cell differentiation in vivo.Mol Ther. 2012 May;20(5):1014-21. doi: 10.1038/mt.2012.46. Epub 2012 Mar 20. Mol Ther. 2012. PMID: 22434137 Free PMC article.
-
Transcription of the 1.688 satellite DNA family is under the control of RNA interference machinery in Drosophila melanogaster ovaries.Genetics. 2007 Jun;176(2):1343-9. doi: 10.1534/genetics.107.071720. Epub 2007 Apr 3. Genetics. 2007. PMID: 17409066 Free PMC article.
-
DNA methylation affects nuclear organization, histone modifications, and linker histone binding but not chromatin compaction.J Cell Biol. 2007 May 7;177(3):401-11. doi: 10.1083/jcb.200607133. J Cell Biol. 2007. PMID: 17485486 Free PMC article.
References
-
- Allen TA, von Kaenel S, Goodrich JA, Kugel JF (2004) The SINE-encoded mouse B2 RNA represses mRNA transcription in response to heat shock. Nat Struct Mol Biol 11: 816–821 - PubMed
-
- Bourc'his D, Bestor TH (2004) Meiotic catastrophe and retrotransposon reactivation in male germ cells lacking Dnmt3L. Nature 431: 96–99 - PubMed
-
- Cawley S, Bekiranov S, Ng HH, Kapranov P, Sekinger EA, Kampa D, Piccolboni A, Sementchenko V, Cheng J, Williams AJ, Wheeler R, Wong B, Drenkow J, Yamanaka M, Patel S, Brubaker S, Tammana H, Helt G, Struhl K, Gingeras TR (2004) Unbiased mapping of transcription factor binding sites along human chromosomes 21 and 22 points to widespread regulation of non-coding RNAs. Cell 116: 499–509 - PubMed
Publication types
MeSH terms
Substances
LinkOut - more resources
Full Text Sources
Other Literature Sources
Molecular Biology Databases

