

A type I DnaJ homolog, DjA1, regulates androgen receptor signaling and spermatogenesis
- PMID: 15660130
- PMCID: PMC548655
- DOI: 10.1038/sj.emboj.7600549
A type I DnaJ homolog, DjA1, regulates androgen receptor signaling and spermatogenesis
Abstract
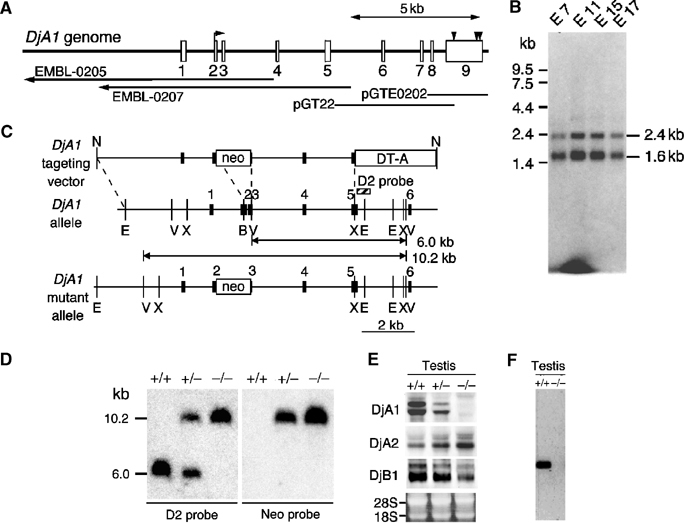
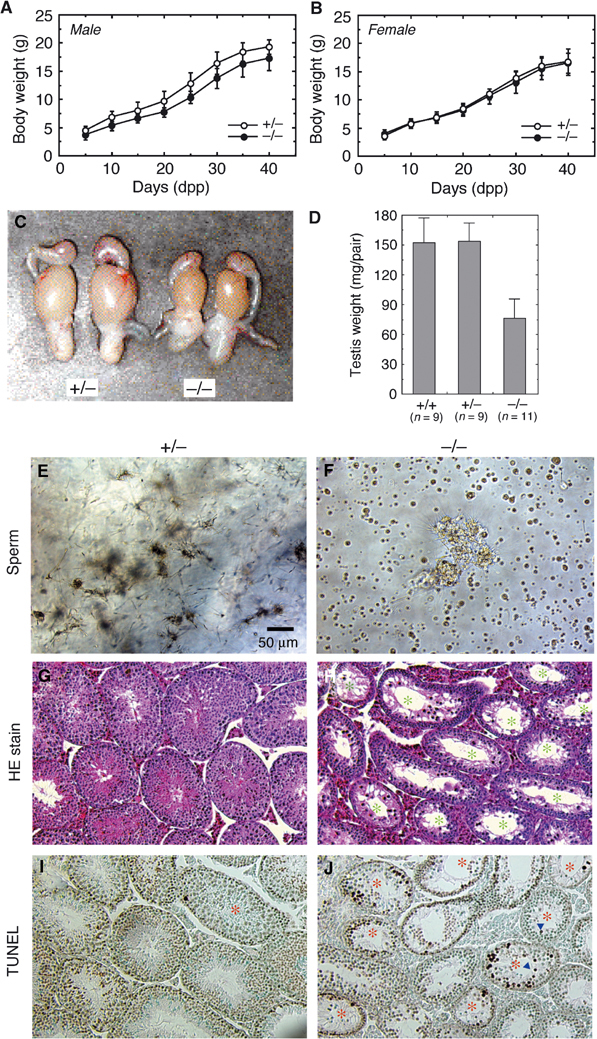
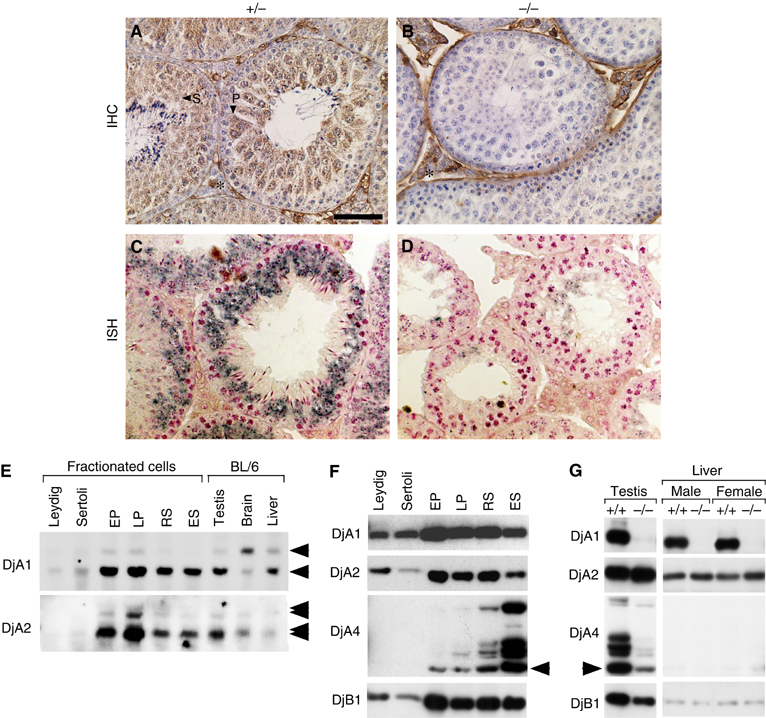
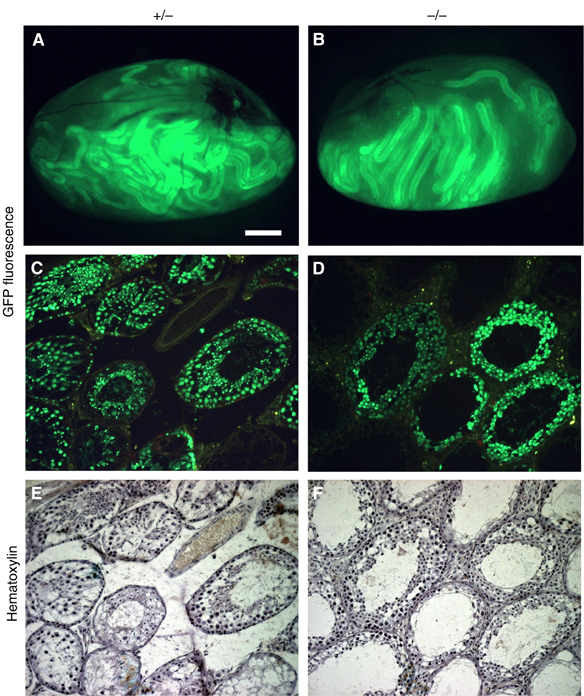
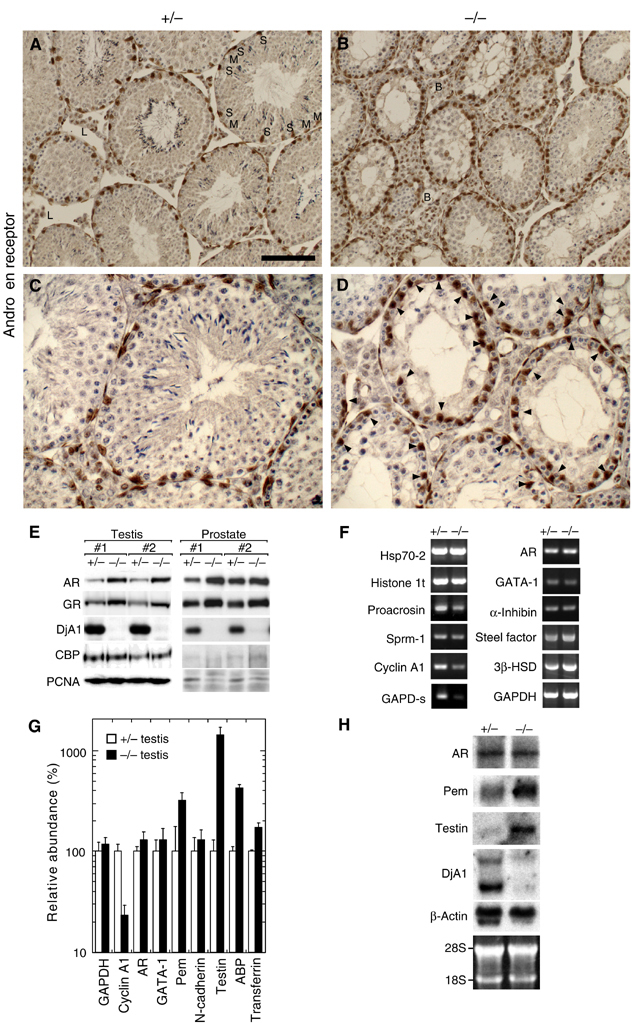
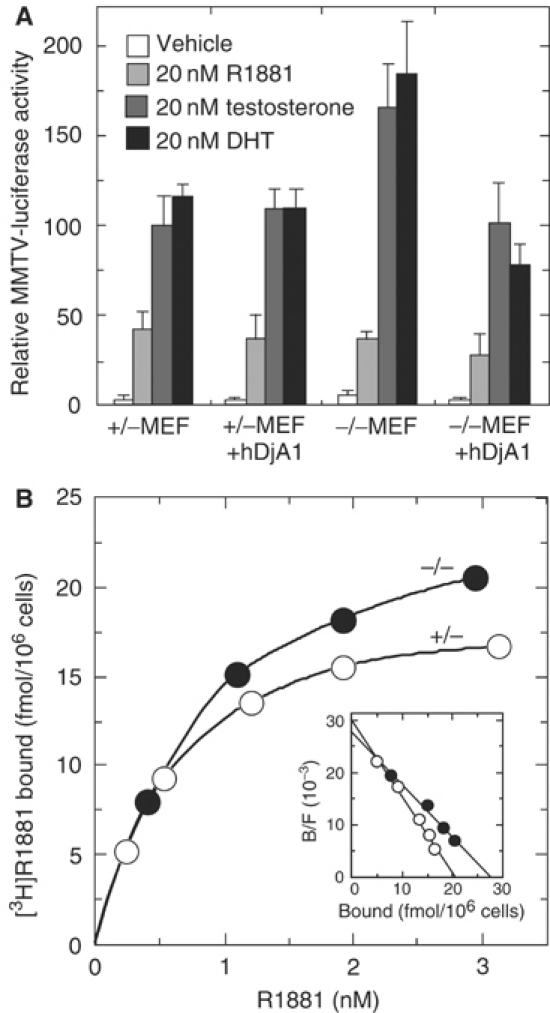
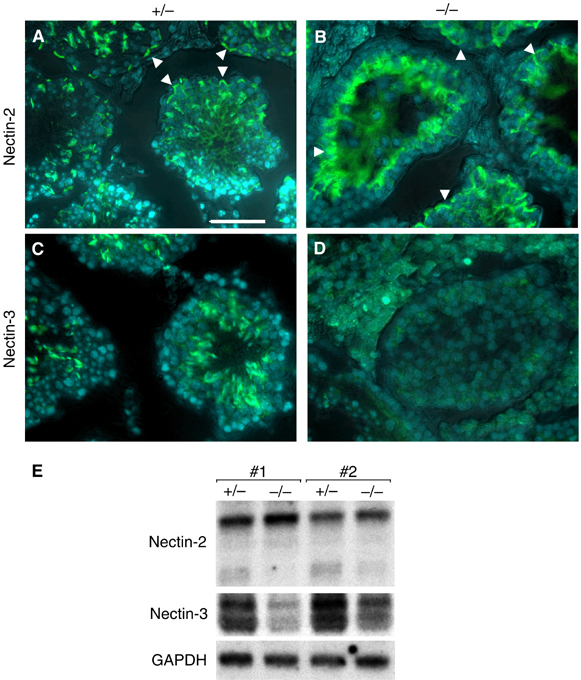
Two type I DnaJ homologs DjA1 (DNAJA1; dj2, HSDJ/hdj-2, rdj1) and DjA2 (DNAJA2; dj3, rdj2) work similarly as a cochaperone of Hsp70s in protein folding and mitochondrial protein import in vitro. To study the in vivo role of DjA1, we generated DjA1-mutant mice. Surprisingly, loss of DjA1 in mice led to severe defects in spermatogenesis that involve aberrant androgen signaling. Transplantation experiments with green fluorescent protein-labeled spermatogonia into DjA1(-/-) mice revealed a primary defect of Sertoli cells in maintaining spermiogenesis at steps 8 and 9. In Sertoli cells of DjA1(-/-) mice, the androgen receptor markedly accumulated with enhanced transcription of several androgen-responsive genes, including Pem and testin. Disruption of Sertoli-germ cell adherens junctions was also evident in DjA1(-/-) mice. Experiments with DjA1(-/-) fibroblasts and primary Sertoli cells indicated aberrant androgen receptor signaling. These results revealed a critical role of DjA1 in spermiogenesis and suggest that DjA1 and DjA2 are not functionally equivalent in vivo.
Figures
Similar articles
-
Characterization and functional analysis of a heart-enriched DnaJ/ Hsp40 homolog dj4/DjA4.Cell Stress Chaperones. 2002 Apr;7(2):156-66. doi: 10.1379/1466-1268(2002)007<0156:cafaoa>2.0.co;2. Cell Stress Chaperones. 2002. PMID: 12380683 Free PMC article.
-
Intratesticular androgen levels, androgen receptor localization, and androgen receptor expression in adult rat Sertoli cells.Biol Reprod. 2004 Oct;71(4):1348-58. doi: 10.1095/biolreprod.104.029249. Epub 2004 Jun 23. Biol Reprod. 2004. PMID: 15215201
-
Modulation of chaperone activities of Hsp70 and Hsp70-2 by a mammalian DnaJ/Hsp40 homolog, DjA4.J Biochem. 2004 Feb;135(2):193-200. doi: 10.1093/jb/mvh023. J Biochem. 2004. PMID: 15047721
-
Methoxyacetic acid disregulation of androgen receptor and androgen-binding protein expression in adult rat testis.Biol Reprod. 2003 Apr;68(4):1437-46. doi: 10.1095/biolreprod.102.004937. Epub 2002 Nov 27. Biol Reprod. 2003. PMID: 12606434
-
What Does Androgen Receptor Signaling Pathway in Sertoli Cells During Normal Spermatogenesis Tell Us?Front Endocrinol (Lausanne). 2022 Feb 24;13:838858. doi: 10.3389/fendo.2022.838858. eCollection 2022. Front Endocrinol (Lausanne). 2022. PMID: 35282467 Free PMC article. Review.
Cited by
-
The Role of Heat Shock Protein 40 in Carcinogenesis and Biology of Colorectal Cancer.Curr Pharm Des. 2022;28(18):1457-1465. doi: 10.2174/1381612828666220513124603. Curr Pharm Des. 2022. PMID: 35570564 Free PMC article. Review.
-
ADAPT identifies an ESCRT complex composition that discriminates VCaP from LNCaP prostate cancer cell exosomes.Nucleic Acids Res. 2020 May 7;48(8):4013-4027. doi: 10.1093/nar/gkaa034. Nucleic Acids Res. 2020. PMID: 31989173 Free PMC article.
-
Protein expression pattern of the molecular chaperone Mdg1/ERdj4 during embryonic development.Histochem Cell Biol. 2020 Sep;154(3):255-263. doi: 10.1007/s00418-020-01881-x. Epub 2020 May 7. Histochem Cell Biol. 2020. PMID: 32377843 Free PMC article.
-
Hsp70/J-protein machinery from Glossina morsitans morsitans, vector of African trypanosomiasis.PLoS One. 2017 Sep 13;12(9):e0183858. doi: 10.1371/journal.pone.0183858. eCollection 2017. PLoS One. 2017. PMID: 28902917 Free PMC article.
-
HSP70/DNAJ Family of Genes in the Brown Planthopper, Nilaparvata lugens: Diversity and Function.Genes (Basel). 2021 Mar 10;12(3):394. doi: 10.3390/genes12030394. Genes (Basel). 2021. PMID: 33801945 Free PMC article.
References
-
- Anway MD, Folmer J, Wright WW, Zirkin BR (2003) Isolation of Sertoli cells from adult rat testes: an approach to ex vivo studies of Sertoli cell function. Biol Reprod 68: 996–1002 - PubMed
-
- Bremner WJ, Millar MR, Sharpe RM, Saunders PT (1994) Immunohistochemical localization of androgen receptors in the rat testis: evidence for stage-dependent expression and regulation by androgens. Endocrinology 135: 1227–1234 - PubMed
-
- Bukau B, Horwich AL (1998) The Hsp70 and Hsp60 chaperone machines. Cell 92: 351–366 - PubMed
-
- Cheng CY, Mruk DD (2002) Cell junction dynamics in the testis: Sertoli–germ cell interactions and male contraceptive development. Physiol Rev 82: 825–874 - PubMed
Publication types
MeSH terms
Substances
LinkOut - more resources
Full Text Sources
Other Literature Sources
Molecular Biology Databases
Research Materials
Miscellaneous
