Comparative Study
. 2005 Feb 9;24(3):439-51.
doi: 10.1038/sj.emboj.7600552. Epub 2005 Jan 20.

Structures of the SUMO E1 provide mechanistic insights into SUMO activation and E2 recruitment to E1

Affiliations
Comparative Study

Structures of the SUMO E1 provide mechanistic insights into SUMO activation and E2 recruitment to E1

Luisa Maria Lois et al. EMBO J. .

Abstract

E1 enzymes facilitate conjugation of ubiquitin and ubiquitin-like proteins through adenylation, thioester transfer within E1, and thioester transfer from E1 to E2 conjugating proteins. Structures of human heterodimeric Sae1/Sae2-Mg.ATP and Sae1/Sae2-SUMO-1-Mg.ATP complexes were determined at 2.2 and 2.75 A resolution, respectively. Despite the presence of Mg.ATP, the Sae1/Sae2-SUMO-1-Mg.ATP structure reveals a substrate complex insomuch as the SUMO C-terminus remains unmodified within the adenylation site and 35 A from the catalytic cysteine, suggesting that additional changes within the adenylation site may be required to facilitate chemistry prior to adenylation and thioester transfer. A mechanism for E2 recruitment to E1 is suggested by biochemical and genetic data, each of which supports a direct role for the E1 C-terminal ubiquitin-like domain for E2 recruitment during conjugation.


Figures

Figure 1
Figure 1
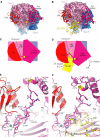
Structure of the SUMO activating enzyme. (A) Ribbon diagram of the Sae1/Sae2 heterodimer Mg·ATP complex. Sae1 is colored blue and Sae2 is colored shades of pink, magenta, and red. (B) Ribbon diagram of the Sae1/Sae2-SUMO-1-Mg·ATP complex. SUMO is colored yellow. Sae1/Sae2 is colored as in (A). Mg·ATP and zinc are labeled and shown in stick and sphere representation. Catalytic Cys and UbL domains are labeled. The active site cysteine is labeled and colored yellow. (C) Orthogonal view of Sae1/Sae2-SUMO-1-Mg·ATP complex as in (B). (D) Orthogonal view of Sae1/Sae2-Mg·ATP complex as in (A). (E) Orthogonal view of Sae1/Sae2-SUMO-1-Mg·ATP complex as in (B). (F) Schematic representation of Sae1/Sae2 and SUMO-1 colored as in (A–E). C-terminal truncation mutants described in the text are indicated above the Sae2 peptide as ΔUbL, ΔCterm, and ΔNLS. Stereo images of panels A and B are provided in Supplementary Figure 1. Images were generated with SETOR or PYMOL unless noted otherwise (Evans, 1993; Delano, 2002).
Figure 2
Figure 2
Conserved SUMO-1 residues and E1 activation. (A) Structure-based alignment of human SUMO family members SUMO-1, -2, -3, S. cerevisiae Smt3, Ub, and Nedd8. SUMO-1 amino-acid numbering, secondary structure, and contact residues with Sae2 (*) are shown above the sequence with sequence similarity ( . ) and identity ( : ) shown below the aligned SUMO sequences. SUMO-1 residues in contact with Sae2 are colored pink (identical), green (similar), or blue (dissimilar). Ub and Nedd8 alignment is shown below the SUMO alignment with (*) denoting contacts observed between Nedd8 and the Nedd8 E1. (B) Ribbon and transparent surface for SUMO-1 with surface residues contacting Sae2 shaded pink, green, or blue as in (A). (C) Time course for formation of E1-thioester, E2-thioester, and SUMO conjugation at 37°C using human SUMO-1, -2, -3, and S. cerevisiae Smt3 as substrates (see Materials and methods and Supplementary Figure 2 for assay details). Labels indicate the positions for E1-thio-SUMO, E2-thio-SUMO, and RanGAP1-SUMO.
Figure 3
Figure 3
Comparison between Sae1/Sae2-Mg·ATP and Sae1/Sae2-SUMO-1-Mg·ATP complexes. (A) Ribbon and surface representations for Sae1/Sae2-Mg·ATP colored as in Figure 1. (B) Sae1/Sae2-SUMO-1-Mg·ATP complex with SUMO-1 colored yellow. (C) Cartoon representation of (A) with Mg·ATP, catalytic cysteine, crossover loop, with UbL and Cys domains labeled. (D) Cartoon representation of (B) with arrows indicating the direction of observed domain rotations (in degrees) and maximal displacement (in Å). (E) Close-up of the Sae1/Sae2-Mg·ATP complex and crossover loop. Mg·ATP and zinc are labeled with amino acids in stick representation. (F) Close-up of the Sae1/Sae2-SUMO-1-Mg·ATP complex and crossover loop as in (E) but now showing amino-acid residues from SUMO-1 (yellow) interacting with Sae2 residues.
Figure 4
Figure 4
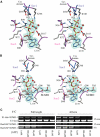
Sae1/Sae2 active sites in complex with Mg·ATP and SUMO-1-Mg·ATP. (A) Stereo representation of the Sae1/Sae2-Mg·ATP complex with a 2.25 Å simulated annealing (SA) omit map contoured at 1.0σ covering the Mg·ATP ligand. (B) Stereo representation of the Sae1/Sae2-SUMO-1-Mg·ATP complex with a 2.75 Å SA omit map contoured at 1σ covering Mg·ATP ligand and SUMO-1 C-terminal amino acids. Residues are numbered in stick representation on a color-coded backbone worm with Sae1 (blue) and Sae2 (pink). The catalytic Cys domain is labeled. Dashed lines represent potential hydrogen bonds; several water molecules were omitted for clarity. (C) ATP dependence of Sae1/Sae2-catalyzed E1-thioester formation and E2-dependent SUMO-1 conjugation to RanGAP1 at 4°C (see Materials and methods). Labels indicate positions for E1-thio-SUMO-1, the E1 Sae2 subunit, and RanGAP1-SUMO-1 after 15 min and 4 h.
Figure 5
Figure 5
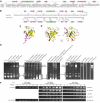
Biochemical and genetic analysis of human Sae2 and yeast Uba2. (A) Schematic representation of human Sae2 and yeast Uba2 subunits indicating domain boundaries between the adenylation (pink), catalytic Cys (magenta), UbL (red), C-terminal (hashed red), and nuclear localization domains (blue hash). Amino-acid numbering is indicated above schematics for yeast and human proteins. (B) Serial dilutions of S. cerevisiae Δuba2 cultures bearing indicated UBA2 alleles were spotted on YPD agar and tested for growth at 23°C (left panel), 30°C (middle panel), and 37°C (right panel). (C) Smt3 conjugation patterns for the strains in panel C as analyzed by SDS–PAGE and Western blotting against Smt3. Conjugates and free Smt3 are indicated by labels. (D) ATP-dependent formation of E1-thioester, E2-thioester, and SUMO conjugation at 37°C after 15 min as catalyzed by Sae1 complexes with full-length Sae2 (1–640), ΔCterm Sae2 (1–549), and ΔUbL Sae2 (1–441). (E) Time course showing formation of E1-thioester, E2-thioester, and SUMO conjugation at 37°C using indicated Sae2 proteins (see Materials and methods). Labels indicate respective positions for E1-thio-SUMO, E2-thio-SUMO, and RanGAP1-SUMO.
Figure 6
Figure 6
Sae2 UbL domain. (A) Structure-based sequence alignment for UbL domains from human SUMO Sae2, Ub Uba1, and Nedd8 Uba3. Sae2 amino-acid numbering and secondary structure are shown above the sequence. Strands and helices are numbered on arrows and bars, respectively. (B) Structure-based sequence alignment for SUMO-1 and the Sae2 UbL domain. Secondary structure for SUMO-1 and UbL domain is shown above and below the sequence, respectively, with discontinuity between the UbL and SUMO-1 structural alignment indicated by ( // ) and residue numbers below the alignment. Asterisks indicate SUMO-1 residues that contact Sae2 with sequence similarity ( . ) and identity ( : ) between the alignment. (C) SUMO-1 structure aligned to the UbL domain as in (D). SUMO-1 residues contacting Sae2 are colored magenta. Secondary structure labeled as in (B). (D) Opposing orientations of the Sae2 UbL domain. Yellow demarcates regions of structure that superimpose with SUMO-1 and magenta indicates insertions or large deviations from the SUMO-1 structure. Strands and helices are numbered as in (A, B). (E) Gel-shift analysis indicating direct interactions between human Ubc9 and the Sae2 UbL domain. Both Ubc9 and Sae2 UbL domain show multiple bands by native gel electrophoresis, thus complexes between Ubc9 and UbL manifest as multiple bands within the gel. Positions of the respective proteins are indicated by brackets and labels with concentrations of the various components indicated at the top of each panel. Asterisks indicate the positions of additional bands described in the text. The bottom of the respective gels corresponds to the positive electrode. Ubc9 cannot be visualized directly on the same gel as it migrates toward the negative electrode. The first panel suggests a stoichiometric interaction between Ubc9 and the UbL domain. The second panel suggests that the Ubc9-UbL interaction cannot be competed for by addition of exogenous SUMO-1 concentrations. The third panel includes controls for panel 2. The fourth and the remaining panels indicate that gel shift of the SUMO E1 UbL domain is specific to Ubc9. (F) Time course for formation of E1-thioester, E2-thioester, and SUMO conjugation at 37°C using Sae2 (1–640) with increasing concentrations of exogenous Sae2 UbL (446–549) (see Materials and methods). Labels indicate positions for E1-thio-SUMO, E2-thio-SUMO, and RanGAP1-SUMO.
Figure 7
Figure 7
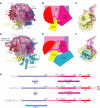
Comparison between SUMO, Nedd8, and Ub E1 enzymes. (A) Ribbon and surface representations for the Sae1/Sae2-SUMO-1-Mg·ATP complex. (B) Cartoon representation of SUMO E1 with Mg·ATP, catalytic cysteine, crossover loop, UbL and Cys domains labeled. (C) Side view of SUMO-1 in ribbon and partial surface representation showing the contact surfaces with Sae2 (magenta). (D) APPBP1/Uba3-Nedd8 complex with Uba3 colored pink and the catalytic Cys and UbL domains in ribbon representation colored magenta and red, respectively. Nedd8 is colored yellow. The APPBP1 domain is colored blue in surface representation with the APPBP1 insertion in ribbon representation (cyan). The Ubc12 binding site is labeled. (E) Cartoon of Nedd8 E1 indicating domain positions and contacts between the APPBP1 insertion and Nedd8. (F) Nedd8 side view in ribbon and surface representation showing contact surfaces with Uba3 (magenta) and APPBP1 (cyan). SUMO-1 in (C) and Nedd8 in (F) are shown as observed in the respective complexes if E1 subunits are aligned. (G) Schematic domain representation observed in human Ub, SUMO, and Nedd8 E1 activating enzymes with domain insertions indicated below each schematic. Numbering and color coding represent domain boundaries.

Similar articles

Cited by

References

    1. Bayer P, Arndt A, Metzger S, Mahajan R, Melchior F, Jaenicke R, Becker J (1998) Structure determination of the small ubiquitin-related modifier SUMO-1. J Mol Biol 280: 275–286 - PubMed
    1. Bencsath KP, Podgorski MS, Pagala VR, Slaughter CA, Schulman BA (2002) Identification of a multifunctional binding site on Ubc9p required for Smt3p conjugation. J Biol Chem 277: 47938–47945 - PubMed
    1. Bohren KM, Nadkarni V, Song JH, Gabbay KH, Owerbach D (2004) A M55V polymorphism in a novel SUMO gene (SUMO-4) differentially activates heat shock transcription factors and is associated with susceptibility to type I diabetes mellitus. J Biol Chem 279: 27233–27238 - PubMed
    1. Brunger AT, Adams PD, Clore GM, DeLano WL, Gros P, Grosse-Kunstleve RW, Jiang JS, Kuszewski J, Nilges M, Pannu NS, Read RJ, Rice LM, Simonson T, Warren GL (1998) Crystallography & NMR system: a new software suite for macromolecular structure determination. Acta Crystallogr D 54: 905–921 - PubMed
    1. Collaborative Computational Project (1994) The CCP4 suite: programs for protein crystallography. Acta Crystallogr D 50: 760–763 - PubMed

Publication types

MeSH terms