Reorganization of visual processing in macular degeneration
- PMID: 15659597
- PMCID: PMC6725316
- DOI: 10.1523/JNEUROSCI.3476-04.2005
Reorganization of visual processing in macular degeneration
Abstract
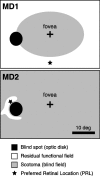
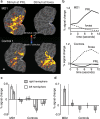
Macular degeneration (MD), the leading cause of visual impairment in the developed world, damages the central retina, often obliterating foveal vision and severely disrupting everyday tasks such as reading, driving, and face recognition. In such cases, the macular damage eliminates the normal retinal input to a large region of visual cortex, comprising tens of square centimeters of surface area in each hemisphere, which is normally responsive only to foveal stimuli. Using functional magnetic resonance imaging, we asked whether this deprived cortex simply becomes inactive in subjects with MD, or whether it takes on new functional properties. In two adult MD subjects with extensive bilateral central retinal lesions, we found that parts of visual cortex (including primary visual cortex) that normally respond only to central visual stimuli are strongly activated by peripheral stimuli. Such activation was not observed (1) with visual stimuli presented to the position of the former fovea and (2) in control subjects with visual stimuli presented to corresponding parts of peripheral retina. These results demonstrate large-scale reorganization of visual processing in MD and will likely prove important in any effort to develop new strategies for rehabilitation of MD subjects.
Figures


Similar articles
-
Reorganization of visual processing in age-related macular degeneration depends on foveal loss.Optom Vis Sci. 2014 Aug;91(8):e199-206. doi: 10.1097/OPX.0000000000000325. Optom Vis Sci. 2014. PMID: 24978868 Free PMC article.
-
Reorganization of visual processing in macular degeneration: replication and clues about the role of foveal loss.Vision Res. 2008 Aug;48(18):1910-9. doi: 10.1016/j.visres.2008.05.020. Epub 2008 Jul 11. Vision Res. 2008. PMID: 18620725 Free PMC article.
-
Reorganization of visual processing is related to eccentric viewing in patients with macular degeneration.Restor Neurol Neurosci. 2008;26(4-5):391-402. Restor Neurol Neurosci. 2008. PMID: 18997314 Clinical Trial.
-
Defective cone photoreceptor cytoskeleton, alignment, feedback, and energetics can lead to energy depletion in macular degeneration.Prog Retin Eye Res. 2004 Sep;23(5):495-522. doi: 10.1016/j.preteyeres.2004.04.005. Prog Retin Eye Res. 2004. PMID: 15302348 Review.
-
Visual function: the problem with eccentricity.Clin Exp Optom. 2005 Sep;88(5):313-21. doi: 10.1111/j.1444-0938.2005.tb06715.x. Clin Exp Optom. 2005. PMID: 16255690 Review.
Cited by
-
A method to characterize compensatory oculomotor strategies following simulated central vision loss.J Vis. 2020 Sep 2;20(9):15. doi: 10.1167/jov.20.9.15. J Vis. 2020. PMID: 32965480 Free PMC article.
-
Using magnetic resonance imaging to assess visual deficits: a review.Ophthalmic Physiol Opt. 2016 May;36(3):240-65. doi: 10.1111/opo.12293. Ophthalmic Physiol Opt. 2016. PMID: 27112223 Free PMC article. Review.
-
Reading text works better than watching videos to improve acuity in a simulation of artificial vision.Sci Rep. 2022 Jul 28;12(1):12953. doi: 10.1038/s41598-022-10719-6. Sci Rep. 2022. PMID: 35902596 Free PMC article.
-
Surface-Based Analyses of Anatomical Properties of the Visual Cortex in Macular Degeneration.PLoS One. 2016 Jan 20;11(1):e0146684. doi: 10.1371/journal.pone.0146684. eCollection 2016. PLoS One. 2016. PMID: 26789126 Free PMC article. Clinical Trial.
-
The HTM Spatial Pooler-A Neocortical Algorithm for Online Sparse Distributed Coding.Front Comput Neurosci. 2017 Nov 29;11:111. doi: 10.3389/fncom.2017.00111. eCollection 2017. Front Comput Neurosci. 2017. PMID: 29238299 Free PMC article.
References
-
- Amedi A, Raz N, Pianka P, Malach R, Zohary E (2003) Early “visual” cortex activation correlates with superior verbal memory performance in the blind. Nat Neurosci 6: 758-766. - PubMed
-
- Baseler HA, Brewer AA, Sharpe LT, Morland AB, Jagle H, Wandell BA (2002) Reorganization of human cortical maps caused by inherited photoreceptor abnormalities. Nat Neurosci 5: 364-370. - PubMed
Publication types
MeSH terms
Grants and funding
LinkOut - more resources
Full Text Sources
Other Literature Sources
Medical
