

When monomers are preferred: a strategy for the identification and disruption of weakly oligomerized proteins
- PMID: 15642257
- PMCID: PMC2765720
- DOI: 10.1016/j.str.2004.10.018
When monomers are preferred: a strategy for the identification and disruption of weakly oligomerized proteins
Abstract
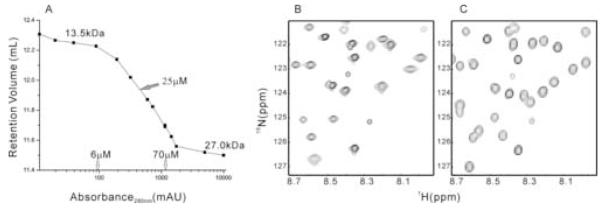
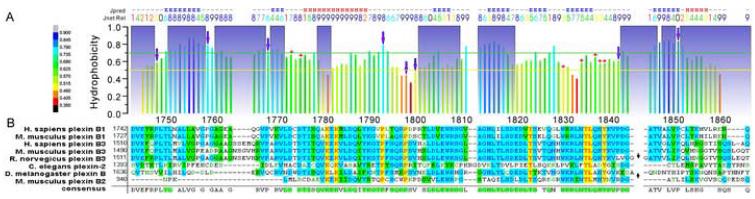
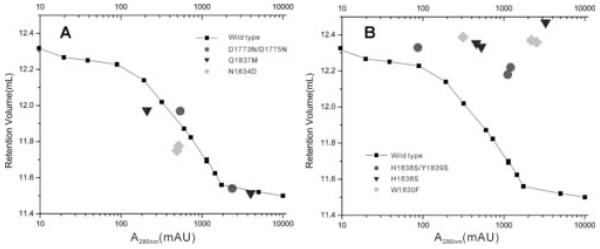
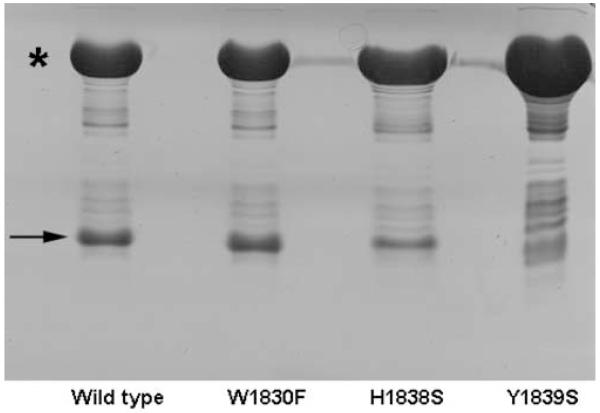
Oligomerization is important for the structure and function of many proteins, but frequently complicates their characterization. It is often desirable to obtain the protein in monomeric form. Here, we report a strategy that allows the generation of monomers from weakly associated oligomers but does not require knowledge of the three-dimensional structure of the protein. The dynamics of protein association are used in solution NMR spectroscopy to identify regions of the polypeptide chain that are likely to be responsible for the interaction. Protein sequence analysis further refines the selection, as conserved sites with moderate hydrophobicity are targeted for modification. Gel filtration and activity assays straightforwardly reveal the consequences of the change and are used to screen for the desired mutants. The strategy is demonstrated for the Rac1 binding domain of plexin-B1. A monomeric variant is generated which preserves the Rac1 binding activity and the wild-type protein structure.
Figures
Similar articles
-
Mutational analysis and NMR spectroscopy of quail cysteine and glycine-rich protein CRP2 reveal an intrinsic segmental flexibility of LIM domains.J Mol Biol. 1999 Oct 1;292(4):893-908. doi: 10.1006/jmbi.1999.3118. J Mol Biol. 1999. PMID: 10525413
-
Structural characterization of the large soluble oligomers of the GTPase effector domain of dynamin.FEBS J. 2006 Jan;273(2):388-97. doi: 10.1111/j.1742-4658.2005.05072.x. FEBS J. 2006. PMID: 16403025
-
Design of lambda Cro fold: solution structure of a monomeric variant of the de novo protein.J Mol Biol. 2005 Dec 9;354(4):801-14. doi: 10.1016/j.jmb.2005.10.005. Epub 2005 Oct 21. J Mol Biol. 2005. PMID: 16289118
-
Applications of NMR to structure-based drug design in structural genomics.J Struct Funct Genomics. 2002;2(2):113-23. doi: 10.1023/a:1020445506369. J Struct Funct Genomics. 2002. PMID: 12836668 Review.
-
Confocal Spectroscopy to Study Dimerization, Oligomerization and Aggregation of Proteins: A Practical Guide.Int J Mol Sci. 2016 Apr 30;17(5):655. doi: 10.3390/ijms17050655. Int J Mol Sci. 2016. PMID: 27144560 Free PMC article. Review.
Cited by
-
Binding of Rac1, Rnd1, and RhoD to a novel Rho GTPase interaction motif destabilizes dimerization of the plexin-B1 effector domain.J Biol Chem. 2007 Dec 21;282(51):37215-24. doi: 10.1074/jbc.M703800200. Epub 2007 Oct 4. J Biol Chem. 2007. PMID: 17916560 Free PMC article.
-
Analysis of 15N-1H NMR relaxation in proteins by a combined experimental and molecular dynamics simulation approach: picosecond-nanosecond dynamics of the Rho GTPase binding domain of plexin-B1 in the dimeric state indicates allosteric pathways.J Phys Chem B. 2013 Jan 10;117(1):174-84. doi: 10.1021/jp310142f. Epub 2012 Dec 28. J Phys Chem B. 2013. PMID: 23214953 Free PMC article.
-
Structural basis of Rnd1 binding to plexin Rho GTPase binding domains (RBDs).J Biol Chem. 2011 Jul 22;286(29):26093-106. doi: 10.1074/jbc.M110.197053. Epub 2011 May 24. J Biol Chem. 2011. PMID: 21610070 Free PMC article.
-
Proline substitution of dimer interface β-strand residues as a strategy for the design of functional monomeric proteins.Biophys J. 2013 Sep 17;105(6):1491-501. doi: 10.1016/j.bpj.2013.08.008. Biophys J. 2013. PMID: 24048001 Free PMC article.
-
Characterisation of a novel cold-adapted calcium-activated transglutaminase: implications for medicine and food processing.FEBS Open Bio. 2020 Apr;10(4):495-506. doi: 10.1002/2211-5463.12826. Epub 2020 Mar 16. FEBS Open Bio. 2020. PMID: 32115900 Free PMC article.
References
-
- Antipenko A, Himanen JP, van Leyen K, Nardi-Dei V, Lesniak J, Barton WA, Rajashankar KR, Lu M, Hoemme C, Puschel AW, Nikolov DB. Structure of the semaphorin-3A receptor binding module. Neuron. 2003;39:589–598. - PubMed
-
- Arrowsmith CH, Wu YS. NMR of large (> 25 kDa) proteins and protein complexes. Prog. NMR Spectrosc. 1998;32:277–286.
-
- Bahadur RP, Chakrabarti P, Rodier F, Janin J. Dissecting subunit interfaces in homodimeric proteins. Proteins. 2003;53:708–719. - PubMed
Publication types
MeSH terms
Substances
Grants and funding
LinkOut - more resources
Full Text Sources
Other Literature Sources
Research Materials
