. 2005;6(1):R1.
doi: 10.1186/gb-2004-6-1-r1. Epub 2004 Dec 15.

Global expression changes resulting from loss of telomeric DNA in fission yeast

Affiliations

Global expression changes resulting from loss of telomeric DNA in fission yeast

Jeffrey G Mandell et al. Genome Biol. 2005.

Abstract

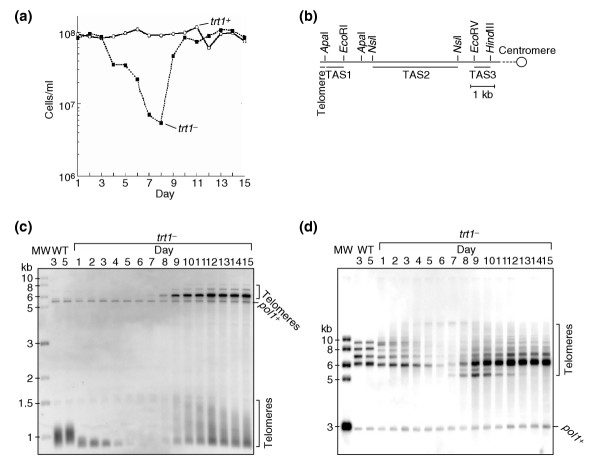
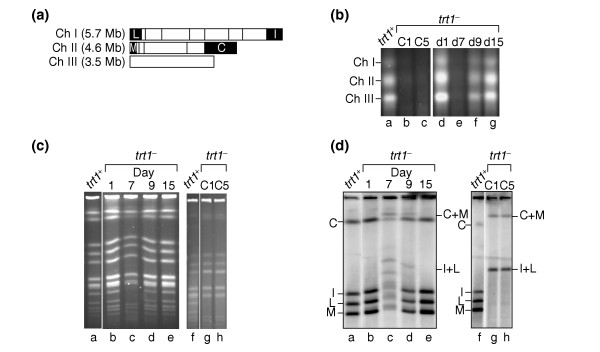
Background: Schizosaccharomyces pombe cells lacking the catalytic subunit of telomerase (encoded by trt1+) lose telomeric DNA and enter crisis, but rare survivors arise with either circular or linear chromosomes. Survivors with linear chromosomes have normal growth rates and morphology, but those with circular chromosomes have growth defects and are enlarged. We report the global gene-expression response of S. pombe to loss of trt1+.

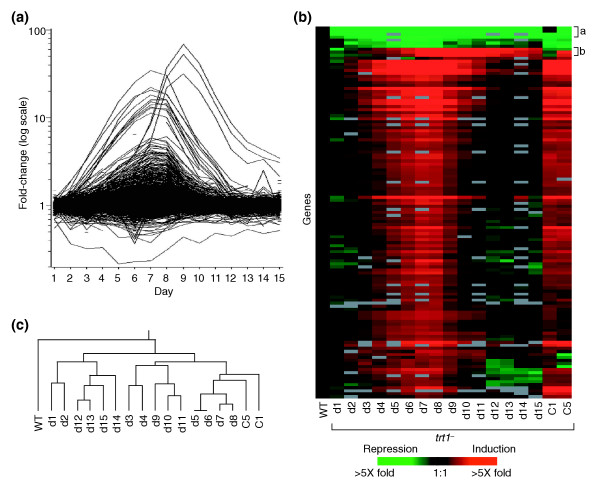
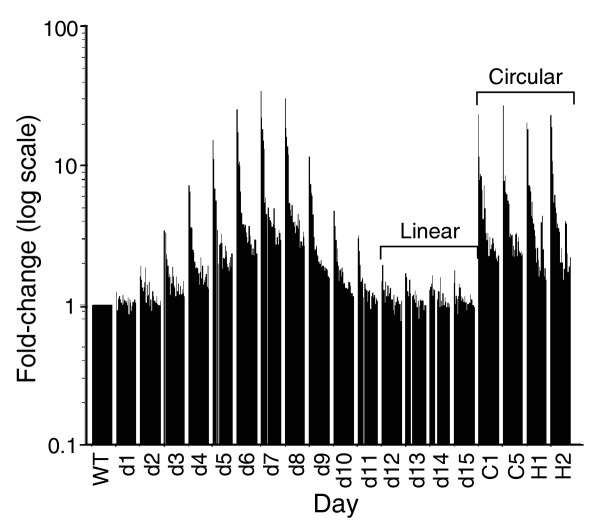
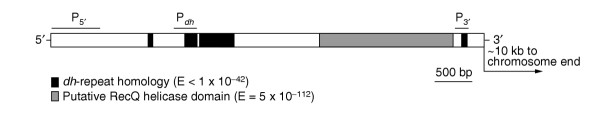
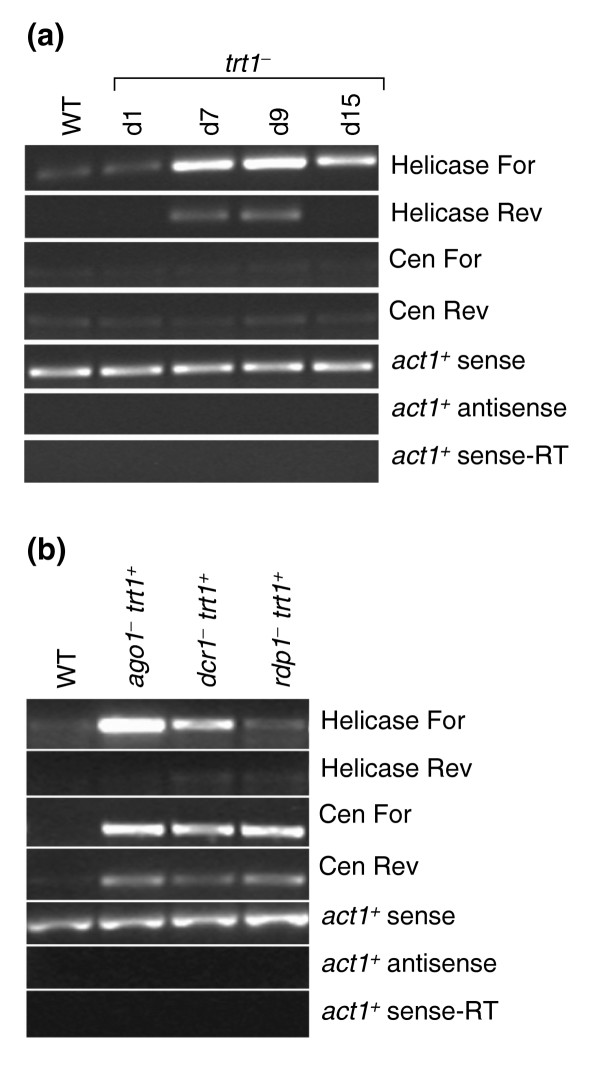
Results: Survivors with linear chromosomes had expression profiles similar to cells with native telomeres, whereas survivors with circular chromosomes showed continued upregulation of core environmental stress response (CESR) genes. In addition, survivors with circular chromosomes had altered expression of 51 genes compared to survivors with linear chromosomes, providing an expression signature. S. pombe progressing through crisis displayed two waves of altered gene expression. One coincided with crisis and consisted of around 110 genes, 44% of which overlapped with the CESR. The second was synchronized with the emergence of survivors and consisted of a single class of open reading frames (ORFs) with homology both to RecQ helicases and to dh repeats at centromeres targeted for heterochromatin formation via an RNA interference (RNAi) mechanism. Accumulation of transcript from the ORF was found not only in trt1- cells, but also in dcr1- and ago1- RNAi mutants, suggesting that RNAi may control its expression.

Conclusions: These results demonstrate a correlation between a state of cellular stress, short telomeres and growth defects in cells with circular chromosomes. A putative new RecQ helicase was expressed as survivors emerged and appears to be transcriptionally regulated by RNAi, suggesting that this mechanism operates at telomeres.


Figures

Figure 1
Figure 1
Stability of wild-type strain gene expression profiles. (a) Microarray expression data for two wild-type biological replicates, WT 3 and WT 5, on day 1 of the growth curve are plotted against each other. The expression data plotted are the normalized ratio of dyes Cy5- and Cy3-dCTP representing sample and reference pool, respectively. Lines showing limits of twofold change are drawn on both sides of the line of identity (identical values between datasets). The axes are log scale. Every gene for which there is data is shown (filled circles). All genes fall within the lines of twofold change. (b) As in (a), except WT 5 from day 1 of the growth curve is compared with WT 5 from day 15. Only three out of 5,050 genes, marked with arrows, changed expression by more than twofold. These genes are SPBC354.08c, encoding a hypothetical protein (2.15-fold); atp8+, F0-ATP synthase subunit 8 (2.15-fold); and cox1+, cytochrome c oxidase subunit I (2.98-fold).
Figure 2
Figure 2
Senescence and emergence of survivors in trt1- cells. (a) Growth curves. YES cultures (200 ml) were inoculated at 2.5 × 10⁴ cells/ml with either trt1+ or trt1- cells. Cell density is shown for trt1+ cells (open circles) and trt1- cells (filled squares) at the end of each 24-h period, after which a new culture was inoculated at 2.5 × 10⁴ cells/ml. When cells were counted on day 1, they had already undergone about 45 generations after germination. Note that when the culture density reached 3-5 × 10⁶ cells/ml, a portion of the cells was harvested for microarray analysis and Southern hybridization. Cells appeared enlarged near day 8 and were morphologically normal by day 11. (b) Restriction-enzyme sites in the TAS of one chromosome arm cloned into the plasmid pNSU70 [58]. Locations of the probes used for Southern hybridization are indicated by the bottom bars. These probes hybridize to multiple chromosome arms because the TASs are found on the four arms of chromosomes I and II and, depending upon the strain background, on one or both arms of chromosome III. (c) Telomere length in wild-type and trt1- strains from the growth curve. DNA (~15 μg) was digested with EcoRI, subjected to electrophoresis, transferred to a nylon membrane and probed with the 32P-labeled telomere fragment shown in (b) that was expected to report the state of the telomere end. As a loading control, a probe for the single-copy gene pol1+ was included. Signals arising from the telomeres are labeled. (d) As in (c), but DNA was digested with HindIII and the blot probed with TAS2 and a fragment of pol1+. The TAS2 probe was expected to hybridize to sequences at least 2 kb, and up to 6 kb, from the telomere end.
Figure 3
Figure 3
Chromosome structures of trt1- survivors. (a) The 13 NotI restriction sites in S. pombe chromosomes I and II [65] are indicated by vertical lines. Chromosome III does not have a NotI site. Terminal fragments are labeled according to convention and highlighted in black. (b) Pulsed-field gel analysis of intact chromosomes visualized by staining with ethidium bromide. Lanes d-g correspond to days 1, 7, 9 and 15 of the growth curve, respectively. (c) Pulsed-field gel of NotI-digested chromosomes visualized with ethidium bromide. Days 1,7, 9 and 15 correspond to days of the growth curve. Lanes a and f were repositioned from the original gel image. (d) The gels from (c) were transferred to a nylon membrane and probed with a mixture of 32P-labeled probes to internal regions of the C, I, L and M fragments, identified in (a). The terminal fragments of linear chromosomes are labeled on the left, and fragments C+M and I+L resulting from circularized chromosomes are shown on the right.
Figure 4
Figure 4
Gene-expression profiles of cells experiencing senescence and survivors. (a) Graph of expression for all genes showing fold-change relative to wild type for each day of the growth curve. Each gene is represented as a line with discontinuities resulting from missing data. For clarity, three genes (missing from the genome, see text) with expression reduced tenfold or more are not shown: trt1+, SPAC2E1P3.04 and SPAC2E1P3.05c. (b) Hierarchical clustering of the 123 genes whose expression changed by twofold or more relative to wild-type in two or more days of the growth curve (see text for details). Samples d1-d15 are days of the growth curve. Each column represents expression of all 123 genes for a unique condition. Each row represents the expression pattern of a single gene throughout all conditions. Genes shown in red had upregulated expression and those in green had downregulated expression. Values of fold-change less than 1.2 are in black, and gray areas indicate missing data. Brackets labeled with letters a-b along the right-hand side denote sets of genes with similar expression patterns for one or more conditions. Band 'a' consists of genes with downregulated expression: SPAC2E1P3.05c, SPAC2E1P3.04, trt1+ and SPBC359.02; and band 'b' represents the second wave of gene expression in the growth curve. The wild-type sample was an average of biological replicates WT 3 and WT 5. (c) Dendrogram of the experimental conditions and strains shown in (b). Experiments were hierarchically clustered on the basis of the similarity of expression ratios of the 123 genes shown in (b).
Figure 5
Figure 5
Expression signatures of cells with circular chromosomes. For each condition, the 51 genes from Table 2 that had expression changes of twofold or more in both strains C1 and C5, but not in survivors with linear chromosomes, are graphed in clusters of vertical bars. The height of each bar represents fold-change in expression relative to wild type. Survivors with linear or circular chromosomes are labeled. Strains H1 and H2 have circular chromosomes as evidenced by their inability to enter into a pulsed-field gel (data not shown). Strains H1 and H2 were not used to derive the expression signature and are shown as an independent verification of it.
Figure 6
Figure 6
Homology of the putative helicase with RecQ helicases and dh repeats. The 5.6 kb sequence of SPAC212.11 is represented as a rectangle. Horizontal lines above the gene indicate the regions spanned by primers used in this study. P3' was the fragment of SPAC212.11 on the microarray (180 bases), and P5' was used in Southern hybridizations (642 bases). Region Pdh was amplified in RT-PCR experiments (Figure 7) to detect dh repeat forward and reverse strands. Solid black rectangles are regions of homology with dh repeats found at centromeres and in the K region of the mating-type locus. The predicted amino-acid sequence of the region marked with cross-hatching has homology with the RecQ helicase family. The BLAST expect (E) value is shown, with the exception that the approximately 70 bp region of homology to dh repeats 3' of the putative RecQ helicase domain has an E value of 2 × 10⁻⁸.
Figure 7
Figure 7
Expression of dh repeats at the sub-telomere. (a) Expression of sub-telomeric dh repeats in trt1- mutants. Strand-specific RT-PCR using primers spanning the region of dh repeats in the putative helicase (Pdh in Figure 6) was used to detect the expression of both forward (For) and reverse (Rev) transcripts. We define the forward transcript to be homologous to the DNA strand running towards the chromosome end in the 5' to 3' direction (this is also the strand with the longest ORF). Strand-specific control reactions were also performed using primers specific for centromeric (Cen) dh repeats [33], as well as act1+ sense and act1+ antisense transcripts (a control lacking reverse transcriptase is labeled -RT). Strains WT 5 and days 1, 7, 9 and 15 of the growth curve are shown. (b) Expression of sub-telomeric dh repeats in RNAi mutants. RNA was isolated from trt1+ RNAi mutant strains ago1-, dcr1- and rdp1- [33], and subjected to strand-specific RT-PCR using the same primers described in (a). A different wild-type strain from that in (a) was used.

Similar articles

Cited by

References

    1. Tham WH, Zakian VA. Transcriptional silencing at Saccharomyces telomeres: implications for other organisms. Oncogene. 2002;21:512–521. doi: 10.1038/sj.onc.1205078. - DOI - PubMed
    1. Greider CW. Telomere length regulation. Annu Rev Biochem. 1996;65:337–365. doi: 10.1146/annurev.bi.65.070196.002005. - DOI - PubMed
    1. McEachern MJ, Krauskopf A, Blackburn EH. Telomeres and their control. Annu Rev Genet. 2000;34:331–358. doi: 10.1146/annurev.genet.34.1.331. - DOI - PubMed
    1. Lundblad V, Szostak JW. A mutant with a defect in telomere elongation leads to senescence in yeast. Cell. 1989;57:633–643. doi: 10.1016/0092-8674(89)90132-3. - DOI - PubMed
    1. McEachern MJ, Blackburn EH. Cap-prevented recombination between terminal telomeric repeat arrays (telomere CPR) maintains telomeres in Kluyveromyces lactis lacking telomerase. Genes Dev. 1996;10:1822–1834. - PubMed

Publication types

MeSH terms

LinkOut - more resources