. 2004 Dec 24:4:33.
doi: 10.1186/1472-6750-4-33.

Dynamic in vivo imaging and cell tracking using a histone fluorescent protein fusion in mice

Affiliations

Dynamic in vivo imaging and cell tracking using a histone fluorescent protein fusion in mice

Anna-Katerina Hadjantonakis et al. BMC Biotechnol. .

Abstract

Background: Advances in optical imaging modalities and the continued evolution of genetically-encoded fluorescent proteins are coming together to facilitate the study of cell behavior at high resolution in living organisms. As a result, imaging using autofluorescent protein reporters is gaining popularity in mouse transgenic and targeted mutagenesis applications.

Results: We have used embryonic stem cell-mediated transgenesis to label cells at sub-cellular resolution in vivo, and to evaluate fusion of a human histone protein to green fluorescent protein for ubiquitous fluorescent labeling of nucleosomes in mice. To this end we have generated embryonic stem cells and a corresponding strain of mice that is viable and fertile and exhibits widespread chromatin-localized reporter expression. High levels of transgene expression are maintained in a constitutive manner. Viability and fertility of homozygous transgenic animals demonstrates that this reporter is developmentally neutral and does not interfere with mitosis or meiosis.

Conclusions: Using various optical imaging modalities including wide-field, spinning disc confocal, and laser scanning confocal and multiphoton excitation microscopy, we can identify cells in various stages of the cell cycle. We can identify cells in interphase, cells undergoing mitosis or cell death. We demonstrate that this histone fusion reporter allows the direct visualization of active chromatin in situ. Since this reporter segments three-dimensional space, it permits the visualization of individual cells within a population, and so facilitates tracking cell position over time. It is therefore attractive for use in multidimensional studies of in vivo cell behavior and cell fate.


Figures

Figure 1
Figure 1
Imaging chromatin in living transgenic ES cells constitutively expressing a H2B-EGFP fusion protein. (a) Bright-field and (b) dark-field micrographs of a CAG::H2B-EGFP ES cell colony. The inset shows a detail with three nuclei in metaphase (pink arrowheads) with the metaphase plates orientated differently. The mitotic spindle of the cell at the top is closely aligned to the z-y plane whereas those for the lower two cells are more closely aligned with the x-z planes. (c) Rendered stack (3-D reconstruction) of sequential optical slices acquired using spinning disc confocal methodology, projected as a fixed angle view of an embryoid body comprised of ES cells constitutively expressing a H2B-EGFP fusion. Pink arrowheads indicate two nuclei in late-anaphase – telophase. Yellow arrowhead points to the nuclear remnant of a cell that has necrosed or apoptosed. (d f) High-power sequential optical sections each (1 μm apart) through ES cells constitutively expressing the H2B-EGFP fusion, taken using laser scanning confocal methodology showing interphase nuclei, a mitotic nucleus (pink arrowhead) and a pycnotic nucleus (yellow arrowhead).
Figure 2
Figure 2
Live imaging the progression through mitosis. Laser scanning confocal x-y images taken at a single z-plane at five minute intervals for one hour. Note that not all green fluorescence (corresponding to nuclear material) will be represented in the plane being imaged. A cell progressing from anaphase to cytokinesis (pink arrowheads). A cell progressing from prophase to telophase (blue arrowheads). The average time taken to transition from early prophase to cytokinesis was calculated to be approximately 1 hour (n = 30).
Figure 3
Figure 3
Live embryo imaging of preimplantation and early postimplantation mouse embryos hemizygous for a constitutively expressed H2B-EGFP fluorescent fusion. (a) Single confocal optical section fluorescence overlay on a bright-field image of a 5-cell stage pre-implantation embryo. Two of the blastomeres are dividing synchronously and are in metaphase (pink arrowheads in b). (b) Dark-field projection of the entire rendered z-stack of x-y sections (n = 19), through the entire embryo shown in panel a. (c) Color-coded depth projection of the entire z-stack of x-y images for the embryo shown in the previous panels. (d) Single confocal optical section fluorescence overlay on a bright-field image of a blastocyst stage embryo. Inner cell mass (ICM) is to the top left corner and second polar body is on the bottom left, juxtaposed to the edge of the ICM. (e) Dark-field projection of half the rendered z-stack of x-y sections (n = 40, sections 1–19 were used for generating the projection), spanning half the embryo shown in panel d. Condensed chromosomes of nuclei in prophase (pink arrowheads) can be seen in three cells of the mural trophectoderm. Cells of the polar trophectoderm (green arrowhead) and inner cell mass (blue arrowhead) can also be distinguished by position within the half-blastocyst reconstruction. (f) Color-coded depth projection of the entire z-stack of x-y images for the embryo shown in the previous two panels. (g-h) Saggital views and rendered z-stacks of x-y images of an E5.75 (pre-streak stage) embryo. (g) Single optical confocal section fluorescence overlay on a bright-field image positioned half the way through the embryo. The brackets on the left illustrate the position of the embryonic (Em) and extraembryonic (Ex) regions of the embryo. (h) The same optical section with only the fluorescence image. Cells of the epiblast (blue arrowhead) and visceral endoderm (green arrowhead) can clearly be distinguished on the basis of position and nuclear morphology. Cells in mitosis can readily be distinguished within the embryo (pink arrowhead). (i) Color-coded depth projection of the stack of serial sections (n = 60), part of the series of which is shown in the previous two panels. Color-coded z-scale (upper right) applies to all projections and denotes distances along the z-axis (0–120 μm).
Figure 4
Figure 4
Live imaging H2B-EGFP in postimplantation mouse embryos. (a) Lateral view of the embryonic region of an E7.5 embryo (anterior to the left) with box depicting the region imaged in b and double-headed arrow depicting the x-y layering of the z-stack. (b-d) single optical x-y sections of fluorescence overlayed on bright-field images acquired at the same focal plane. Each panel is 60 μm apart from the preceding panel. These panels comprise x-y images in the z-stack depicted in panel a. The different layers of this stage of embryo including the epiblast, mesoderm, visceral endoderm and node can be distinguished on the basis of both position and nuclear morphology. (e-h) projection of a rendered z-stack of (x-y) sections (n = 90) of the dark-field component of the sections taken in the series schematized in a and of the raw data shown in b. (e) 0° rotation, (f) 60° rotation, (g) 120° rotation, and (h) 180° rotation views. (i) low-magnification frontal view of an E11 embryo that has had a transverse cut made to remove the head. The box depicts the region (at the ventral hindbrain and 1st branchial pouch) subject to laser scanning confocal imaging, with the double-headed arrow depicting the x-y layering of the acquired z-stack. (j) rendered (z-) stack of sections (n = 200, i.e. 400 μm depth) taken through the boxed region. (k) rendered stack of top 50 x-y sections (100 μm depth) taken from the region imaged around the notochord (comprising axial mesoderm and mesenchyme cells). (l) rendered stack of top 50 sections (100 μm depth) taken around the branchial pouch region (comprising endoderm and mesenchyme cells). The sections used to generate the rendered stacks in panels k and l were electronically magnified. Pink arrowheads, mitotic nuclei; yellow arrowheads, pycnotic nuclei; ect, ectoderm, en, endoderm, hf, headfold, mes, mesoderm, noto, notochord.
Figure 5
Figure 5
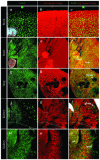
High resolution live imaging of the organs of CAG::H2B-EGFP adult mice. Confocal images of freshly isolated organs from a 6 week old adult male hemizygous CAG::H2B-EGFP Tg/+ animal illustrate the widespread nuclear localized expression of the histone fusion. A transverse cut was made through each organ and the cut surface was placed closest to the objective lens and imaged. Cell tracker orange was used as a vital cytoplasmic counter stain. The panels show rendered confocal z-stacks imaged through 80 μm of the brain using a 20x plan-apo objective (a-c), 568 μm of the heart using a 5x fluar objective (d-f), 142 μm of a lung lobe using a 5x fluar objective (g-i) and 346 μm of a kidney using a 5x fluar objective low power view (j-l), and high power view (m-o). Insets in panels a and d show the region of the brain and heart imaged, respectively. High resolution images of the kidney (m-o) illustrate electronic magnification of the data shown in j-l. Bron, bronchus; glom, glomeruus; med, medulla; sept, septum; ub, ureteric bud; ven, ventricle. Areas of increased fluorescence in the red channel are an artefact due to saturated pixels in regions of the sample closest to the objective.
Figure 6
Figure 6
Dynamic time-lapse imaging of mouse CAG::H2B-EGFP transgenic ES cells, preimplantation and postimplantation embryos using different imaging modalities. (a) Rendered confocal stacks of transgenic ES cells constitutively expressing a CAG::H2B-EGFP transgene representing a 25 minute time-lapse recording of images acquired using a spinning disc confocal scan head. x-y sections with a z-interval of 0.2 μm were taken at a rate of 10/second over a total z-stack of 40 μm. Cells can be traced through the 4D rendered stack. Cells entering or completing mitosis (pink arrowheads) and the nuclear remnant of a cell that has either undergone apoptosis or necrosis (yellow arrowhead) are clearly visible. (b) Wide-field imaging of CAG::H2B-EGFP transgenic preimplantation embryos. This 24 hour image sequence illustrates cavitation leading up to the formation of the blastocyst in several embryos (violet arrowheads). (c) Rendered two-photon stacks of CAG::H2B-EGFP transgenic gastrulation stage postimplantation embryos. This 40 minute time-lapse sequence illustrates cell division and tracking within the visceral endoderm (green arrowhead) and epiblast (blue arrowheads) and the movement of mesoderm emanating from the primitive streak, which is positioned to the right, out of the field of view. Scale bar in a = 10 μm, b = 100 μm and c = 50 μm.
Figure 7
Figure 7
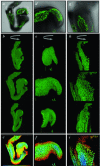
High-resolution 3-dimensional imaging of fixed CAG::H2B-EGFP transgenic embryos. Confocal images of an E8.5 CAG::H2B-EGFP transgenic embryo fixed in 4% paraformaldehyde for 72 hours, then washed, stored and imaged in PBS. Low-magnification views and reconstructions of whole embryo (a-c). Boxes in a designate region imaged in d and g. High-magnification views of the headfolds (d-f) and posterior primitive streak and proximal allantois (g-i). Single xy images (a, d and g) from the z-stacks used to computationally render the data sets. These images are overlayed onto the bright field channel so as to display the outline of the embryo. Rotations through the rendered z-stacks displayed at 45° intervals (b, e and h). Color-coded depth projections of each of the z-stacks (c, f and i).

Similar articles

Cited by

References

    1. Stephens DJ, Allan VJ. Light microscopy techniques for live cell imaging. Science. 2003;300:82–86. doi: 10.1126/science.1082160. - DOI - PubMed
    1. Denk W, Strickler JH, Webb WW. Two-photon laser scanning fluorescence microscopy. Science. 1990;248:73–76. - PubMed
    1. Chalfie M, Tu Y, Euskirchen G, Ward WW, Prasher DC. Green fluorescent protein as a marker for gene expression. Science. 1994;263:802–805. - PubMed
    1. Lippincott-Schwartz J, Patterson GH. Development and use of fluorescent protein markers in living cells. Science. 2003;300:87–91. doi: 10.1126/science.1082520. - DOI - PubMed
    1. Bak M, Fraser SE. Axon fasciculation and differences in midline kinetics between pioneer and follower axons within commissural fascicles. Development. 2003;130:4999–5008. doi: 10.1242/dev.00713. - DOI - PubMed

Publication types

MeSH terms