

DNA replication-timing analysis of human chromosome 22 at high resolution and different developmental states
- PMID: 15591350
- PMCID: PMC539744
- DOI: 10.1073/pnas.0408170101
DNA replication-timing analysis of human chromosome 22 at high resolution and different developmental states
Abstract
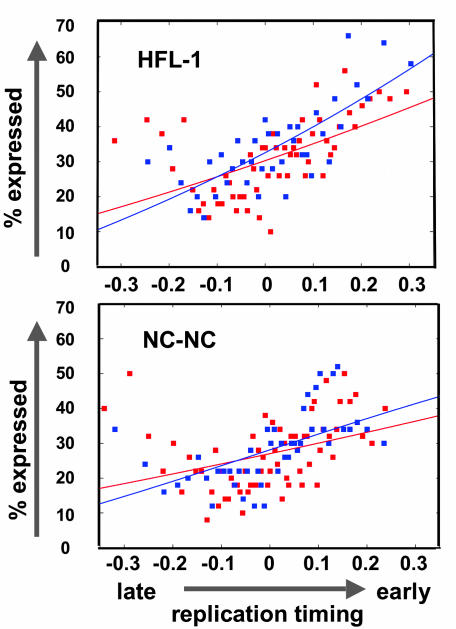
Duplication of the genome during the S phase of the cell cycle does not occur simultaneously; rather, different sequences are replicated at different times. The replication timing of specific sequences can change during development; however, the determinants of this dynamic process are poorly understood. To gain insights into the contribution of developmental state, genomic sequence, and transcriptional activity to replication timing, we investigated the timing of DNA replication at high resolution along an entire human chromosome (chromosome 22) in two different cell types. The pattern of replication timing was correlated with respect to annotated genes, gene expression, novel transcribed regions of unknown function, sequence composition, and cytological features. We observed that chromosome 22 contains regions of early- and late-replicating domains of 100 kb to 2 Mb, many (but not all) of which are associated with previously described chromosomal bands. In both cell types, expressed sequences are replicated earlier than nontranscribed regions. However, several highly transcribed regions replicate late. Overall, the DNA replication-timing profiles of the two different cell types are remarkably similar, with only nine regions of difference observed. In one case, this difference reflects the differential expression of an annotated gene that resides in this region. Novel transcribed regions with low coding potential exhibit a strong propensity for early DNA replication. Although the cellular function of such transcripts is poorly understood, our results suggest that their activity is linked to the replication-timing program.
Figures
Similar articles
-
Topologically associating domains are stable units of replication-timing regulation.Nature. 2014 Nov 20;515(7527):402-5. doi: 10.1038/nature13986. Nature. 2014. PMID: 25409831 Free PMC article.
-
Predictable dynamic program of timing of DNA replication in human cells.Genome Res. 2009 Dec;19(12):2288-99. doi: 10.1101/gr.094060.109. Epub 2009 Sep 18. Genome Res. 2009. PMID: 19767418 Free PMC article.
-
Regulation of DNA replication timing on human chromosome by a cell-type specific DNA binding protein SATB1.PLoS One. 2012;7(8):e42375. doi: 10.1371/journal.pone.0042375. Epub 2012 Aug 7. PLoS One. 2012. PMID: 22879953 Free PMC article.
-
Space and time in the nucleus: developmental control of replication timing and chromosome architecture.Cold Spring Harb Symp Quant Biol. 2010;75:143-53. doi: 10.1101/sqb.2010.75.011. Epub 2010 Dec 7. Cold Spring Harb Symp Quant Biol. 2010. PMID: 21139067 Review.
-
DNA replication timing, genome stability and cancer: late and/or delayed DNA replication timing is associated with increased genomic instability.Semin Cancer Biol. 2013 Apr;23(2):80-9. doi: 10.1016/j.semcancer.2013.01.001. Epub 2013 Jan 14. Semin Cancer Biol. 2013. PMID: 23327985 Free PMC article. Review.
Cited by
-
Late replication domains in polytene and non-polytene cells of Drosophila melanogaster.PLoS One. 2012;7(1):e30035. doi: 10.1371/journal.pone.0030035. Epub 2012 Jan 10. PLoS One. 2012. PMID: 22253867 Free PMC article.
-
USF binding sequences from the HS4 insulator element impose early replication timing on a vertebrate replicator.PLoS Biol. 2012;10(3):e1001277. doi: 10.1371/journal.pbio.1001277. Epub 2012 Mar 6. PLoS Biol. 2012. PMID: 22412349 Free PMC article.
-
Assessing the performance of different high-density tiling microarray strategies for mapping transcribed regions of the human genome.Genome Res. 2007 Jun;17(6):886-97. doi: 10.1101/gr.5014606. Epub 2006 Nov 21. Genome Res. 2007. PMID: 17119069 Free PMC article.
-
Epigenetic landscape for initiation of DNA replication.Chromosoma. 2014 Jun;123(3):183-99. doi: 10.1007/s00412-013-0448-3. Epub 2013 Dec 17. Chromosoma. 2014. PMID: 24337246 Review.
-
DNA Replication Timing Enters the Single-Cell Era.Genes (Basel). 2019 Mar 15;10(3):221. doi: 10.3390/genes10030221. Genes (Basel). 2019. PMID: 30884743 Free PMC article. Review.
References
-
- Huberman, J. A. & Riggs, A. D. (1968) J. Mol. Biol. 32, 327-341. - PubMed
-
- Hand, R. (1978) Cell 15, 317-325. - PubMed
-
- Dutrillaux, B., Couturier, J., Richer, C. L. & Viegas-Pequinot, E. (1976) Chromosoma 58, 51-61. - PubMed
-
- Cimbora, D. M. & Groudine, M. (2001) Cell 104, 643-646. - PubMed
-
- Drouin, R., Holmquist, G. P. & Richer, C. L. (1994) Adv. Hum. Genet. 22, 47-115. - PubMed
Publication types
MeSH terms
Substances
Grants and funding
LinkOut - more resources
Full Text Sources
Other Literature Sources
Molecular Biology Databases
Miscellaneous
