Comparative Study
. 2004 Dec 1;561(Pt 2):415-32.
doi: 10.1113/jphysiol.2004.075051. Epub 2004 Oct 7.

Multiple regulation by calcium of murine homologues of transient receptor potential proteins TRPC6 and TRPC7 expressed in HEK293 cells

Affiliations
Comparative Study

Multiple regulation by calcium of murine homologues of transient receptor potential proteins TRPC6 and TRPC7 expressed in HEK293 cells

Juan Shi et al. J Physiol. .

Abstract

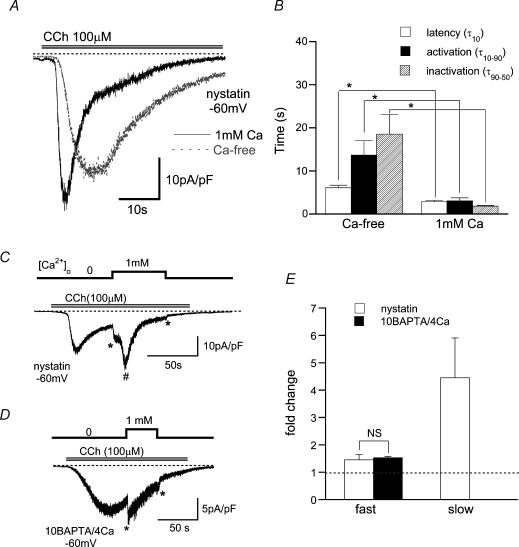
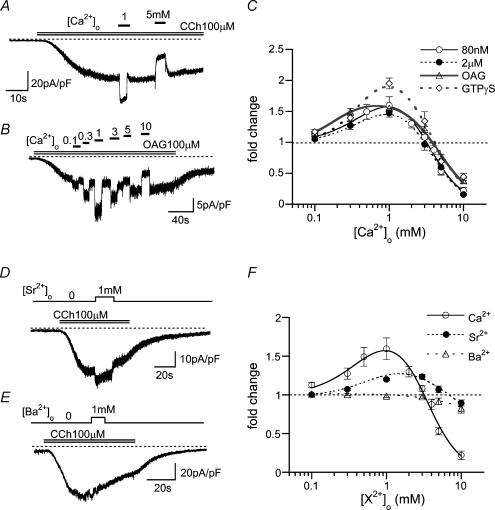
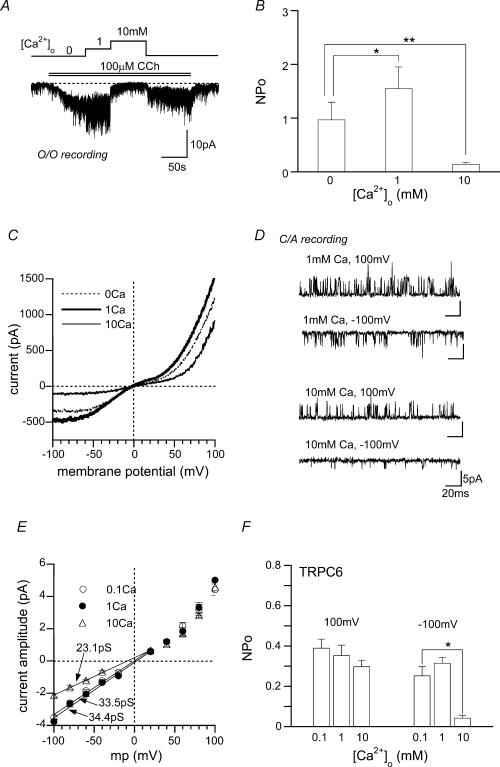
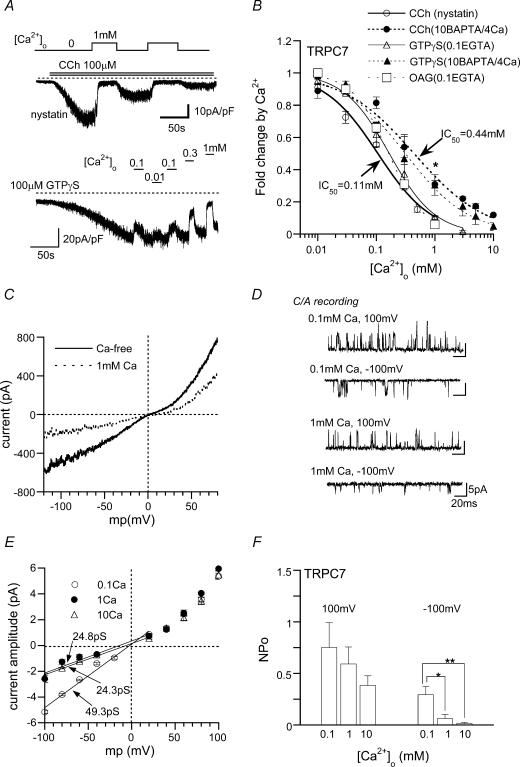
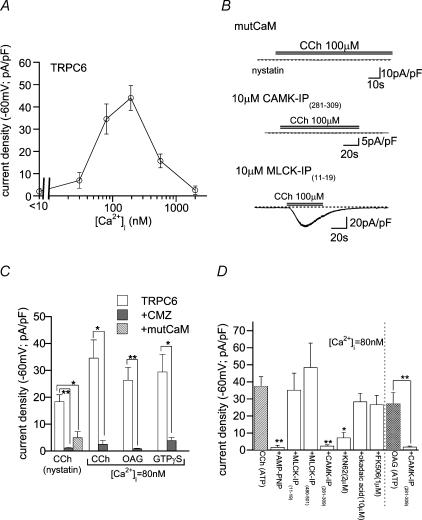
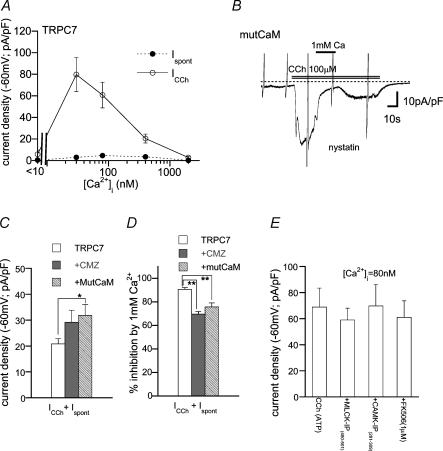
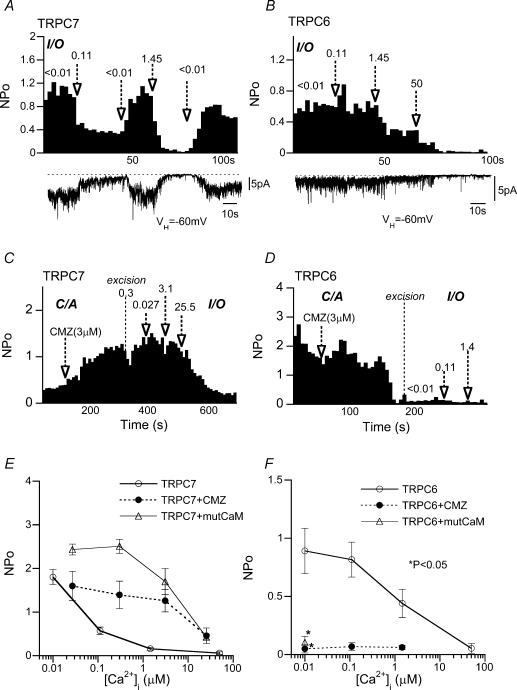
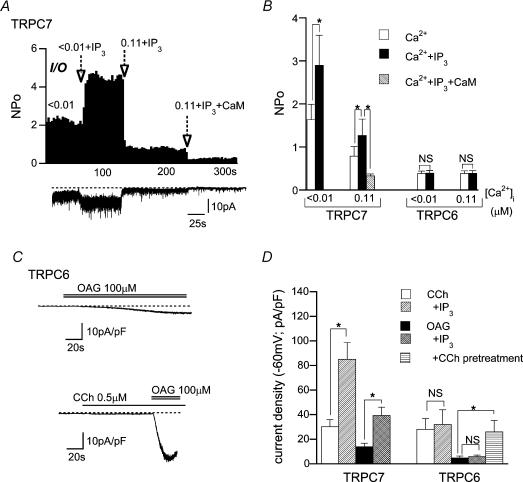
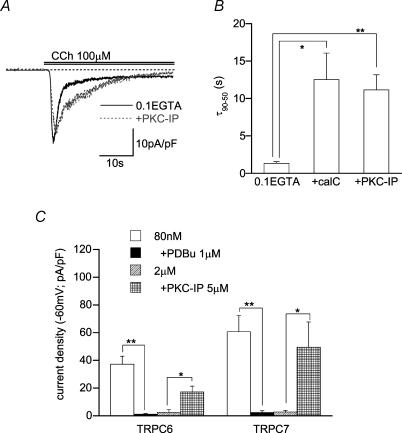
We investigated, by using the patch clamp technique, Ca2+-mediated regulation of heterologously expressed TRPC6 and TRPC7 proteins in HEK293 cells, two closely related homologues of the transient receptor potential (TRP) family and molecular candidates for native receptor-operated Ca2+ entry channels. With nystatin-perforated recording, the magnitude and time courses of activation and inactivation of carbachol (CCh; 100 microM)-activated TRPC6 currents (I(TRPC6)) were enhanced and accelerated, respectively, by extracellular Ca2+ (Ca2+(o)) whether it was continuously present or applied after receptor stimulation. In contrast, Ca2+(o) solely inhibited TRPC7 currents (I(TRPC7)). Vigorous buffering of intracellular Ca2+ (Ca2+(i)) under conventional whole-cell clamp abolished the slow potentiating (i.e. accelerated activation) and inactivating effects of Ca2+(o), disclosing fast potentiation (EC50: approximately 0.4 mM) and inhibition (IC50: approximately 4 mM) of I(TRPC6) and fast inhibition (IC50: approximately 0.4 mM) of I(TRPC7). This inhibition of I(TRPC6) and I(TRPC7) seems to be associated with voltage-dependent reductions of unitary conductance and open probability at the single channel level, whereas the potentiation of I(TRPC6) showed little voltage dependence and was mimicked by Sr2+ but not Ba2+. The activation process of I(TRPC6) or its acceleration by Ca2+(o) probably involves phosphorylation by calmodulin (CaM)-dependent kinase II (CaMKII), as pretreatment with calmidazolium (3 microM), coexpression of Ca2+-insensitive mutant CaM, and intracellular perfusion of the non-hydrolysable ATP analogue AMP-PNP and a CaMKII-specific inhibitory peptide all effectively prevented channel activation. However, this was not observed for TRPC7. Instead, single CCh-activated TRPC7 channel activity was concentration-dependently suppressed by nanomolar Ca2+(i) via CaM and conversely enhanced by IP3. In addition, the inactivation time course of I(TRPC6) was significantly retarded by pharmacological inhibition of protein kinase C (PKC). These results collectively suggest that TRPC6 and 7 channels are multiply regulated by Ca2+ from both sides of the membrane through differential Ca2+-CaM-dependent and -independent mechanisms.


Figures

Figure 1
Figure 1. Acceleration of activation and inactivation time courses of murine TRPC6 currents by extracellular Ca2+ (Ca2+o)
Holding potential: −60 mV. A, typical traces for CCh (100 μm)-evoked TRPC6 currents (ITRPC6) in the presence (black, continuous line) and absence (grey, dotted line) of 1 mm Ca2+ in the bath, recorded from the same cell with nystatin-perforated recording. B, summary of latency (τ10; time for 10% activation of the peak from the onset of CCh application), activation time (τ10–90; time for 10–90% activation of the peak), and inactivation time (τ90–50; time for 90–50% of the peak in inactivation phase) of ITRPC6 with 0 and 1 mm Ca2+ evaluated from the experiments as shown in A(n = 12). Repeated application of CCh at short intervals (< 5min) usually resulted in a rundown and slowed activation and deactivation of ITRPC6. To minimize the errors arising from this problem, ITRPC6 was activated at an interval of 10 min, which led to recovery of the second response to CCh to 0.82 ± 0.09 of the first one (n = 9; evaluated in Ca2+-free external solution), and the response in the presence of Ca2+o was taken on the second application of CCh. C and D, ITRPC6 was first activated in the absence of Ca2+o and then exposed to 1 mm Ca2+o, under nystatin-perforated and conventional whole-cell (10 BAPTA/4 Ca internal solution) voltage clamp, respectively. E; summary of the effects of Ca2+o (1 mm) on ITRPC6 such as illustrated in C and D. Relative ITRPC6 amplitude (fold change) is calculated as the ratio of ITRPC6 amplitude just after to that before (no Ca2+ present) application of Ca2+o. For slow Ca2+o-induced potentiation (#), ITRPC6 amplitude at the peak potentiation was normalized to that just before application of Ca2+o. Symbols ‘*–*’ and ‘#’ stand for the fast potentiation and slow potentiation, respectively. n = 5–8. ‘*’ in B; P < 0.05 with paired t test. ‘NS’ in E denotes no statistical significance.
Figure 2
Figure 2. Biphasic effects of Ca2o+ on ITRPC6 under strongly intracellular Ca2+ (Ca2i+)-buffering conditions
Recording conditions used were the same as in Fig. 1D. A and B, typical examples of ITRPC6 at varying [Ca2+]o evoked by 100 μm CCh (A) or OAG (B). C, relationships between [Ca2+]o and relative ITRPC6 amplitude (fold change) under various conditions; 100 μm CCh with [Ca2+]i= 80 nm (10 mm BAPTA/4 mM Ca2+, open circles) or 2 μm (10 mm BAPTA/9.5 mm Ca2+, filled circles); 100 μm OAG ([Ca2+]i: 80 nm, open triangles); 100 μm GTPγS ([Ca2+]i: 80 nm, open diamonds). n = 5–12. D and E, typical examples of the effects of 1 mm extracellular Sr2+ (D) and Ba2+ (E) on ITRPC6 evoked by 100 μm CCh ([Ca2+]i: 80 nm). F; relationships between relative ITRPC6 amplitude (fold change) and extracellular Ca2+, Sr2+ or Ba2+ concentration. n = 5–14. Curves in C and F are drawn according to the results of double Hill fitting (see Methods), which gave the EC50 and IC50 values (mm), respectively, in C of 0.44 and 3.56 (80 nm), 0.42 and 3.61 (2 μm), 0.38 and 4.27 (OAG), and 0.41 and 3.54 (GTPγS), and in F, 0.44 and 3.56 (Ca2+), and 0.84 and 7.44 (Sr2+).
Figure 3
Figure 3. Potentiating and inhibitory effects of Ca2o+ on single TRPC6 channels
A and B, O/O recording at −60 mV. O/O membranes were sequentially exposed to CCh (100 μm) and three different [Ca2+]o. A representative record (A) and the summary of five separate O/O experiments (B). Averaged NPo is plotted against [Ca2+]o. C, typical current–voltage (I–V) relationships of ITRPC6 at different [Ca2+]o (0, 1 or 10 mm Ca2+ in the bath) evaluated from the same cell. D–F, C/A recording. Transmembrane potential was zeroed by high K+ external solution. Typical examples of single CCh-activated TRPC6 channels at two different Ca2+ concentrations in the pipette (i.e. [Ca2+]o= 1 or 10 mm) and membrane potentials (−100 or 100 mV) (D), and I–V relationships (E) and [Ca2+]o dependence of NPo (F) of CCh-activated TRPC6 channels. n = 5. In E, numerals indicate the unitary conductances evaluated by linear data fitting between −100 and 20 mV (continuous lines). *P < 0.05, **P < 0.01 with paired t test (in B) or ANOVA and pooled variance t test (in F).
Figure 4
Figure 4. Inhibitory effects of Ca2o+ on ITRPC7 and single TRPC7 channels
A, typical examples of Ca2+o-induced inhibition of ITRPC7 recorded at −60 mV, with nystatin-perforated (upper panel) or conventional whole-cell (10 BAPTA/4 Ca internal solution: lower panel) recordings. In the latter, GTPγS (100 μm) was included in a patch pipette. B; relationships between [Ca2+]o and relative ITRPC7 amplitude (fold change induced by Ca2+o) under various conditions. Different activators (100 μm CCh, OAG and GTPγS) and different modes of voltage-clamp (nystatin-perforated and conventional whole-cell recording with either 10 BAPTA/4 Ca or 0.1 EGTA-internal solution) were tested. *P < 0.05 with unpaired t test for open versus filled circles. Curves are drawn according to the results of single Hill fitting (see Methods). n = 5–10. C, typical I–V relationships for ITRPC7 obtained just before (Ca2+-free) and after the addition of 1 mm Ca2+o. D–F, C/A recording. Typical examples of single CCh-activated TRPC7 channels at [Ca2+]o of 0.1, 1 or 10 mm and membrane potentials of −100 or 100 mV (D), and I–V relationships (E) and [Ca2+]o dependence of NPo (F) of CCh-activated TRPC7 channels. n = 5. Continuous lines and the meaning of numerals in E are the same as in Fig. 3E. *P < 0.05, **P < 0.01 with ANOVA and pooled variance t test.
Figure 5
Figure 5. Essential requirement of CaM-kinase II-mediated phosphorylation for TRPC6 channel activation
Bath: 1 mm Ca2+-containing external solution. A, relationship between [Ca2+]i and CCh (100 μm)-evoked ITRPC6 density. n = 5–19. B, typical examples of ITRPC6 recorded from cells coexpressing Ca2+-insensitive mutant calmodulin (mutCaM; nystatin-perforated recording; top trace) and those intracellularly perfused (> 5min; whole-cell; [Ca2+]i: 80 nm; 10 mm BAPTA/4 mm Ca2+) with 10 μm CaM-kinase inhibitory peptide (middle trace) or MLCK inhibitory peptide (bottom trace). C; effects of calmidazolium (CMZ; 3 μm) pretreatment or mutCaM coexpression on ITRPC6 evoked by 100 μm CCh, OAG or GTPγS. n = 5–15. D; effects of kinase and phosphatase inhibitors on ITRPC6 evoked by 100 μm CCh or OAG. Whole-cell recording ([Ca2+]i: 80 nm). n = 7–17. *P < 0.05, **P < 0.01 with unpaired t test (C: rightmost two columns in D) and with ANOVA and pooled variance t test (the other columns in D: control is hatched).
Figure 6
Figure 6. CaM-mediated inhibition of I
TRPC7Bath: Ca2+-free external solution. A, relationship between [Ca2+]i and spontaneously activated (Ispont) or CCh (100 μm)-evoked (ICCh) ITRPC7. n = 8–14. Whole-cell recording. B, a typical example of ITRPC7 recorded from a mutCaM-coexpressing cell under nystatin-perforated voltage clamp. C and D, CMZ pretreatment (3 μm) or mutCaM coexpression enhances the density (C) and relieves Ca2+o (1 mm)-induced inhibition (D) of ITRPC7. Nystatin-perforated recording. n = 7–20. E, ineffectiveness of inhibitors for MLCK, CaMKII and calcineurin for ITRPC7. n = 5–8. *P < 0.05, **P < 0.01 with ANOVA and pooled variance t test.
Figure 7
Figure 7. Differential dependence of single TRPC6 and TRPC7 channels on Ca2i+ and CaM
I/O recording at −60 mV. A and B, typical traces (lower panels) and corresponding NPoversus time plots (upper panels) for CCh-activated TRPC7 (A) and TRPC6 (B) channels at different [Ca2+]i. Numerals and arrows indicate the value of [Ca2+]i (micromolar) and the timing of solution change, respectively. C and D, effects of CMZ on CCh-activated TRPC7 (C) and TRPC6 (D) channels. NPoversus time plots. CMZ (3 μm) was applied in C/A mode, and then patch membranes were excised (I/O mode). E and F, NPo−[Ca2+]i relationships (I/O mode) for CCh-activated TRPC7 and TRPC6 channels, without (open circles) or with CMZ (3 mm) treatment (filled circles) or mutCaM coexpression (open triangles). n = 5–9. *P < 0.05 with pooled variance t test for filled circle or open triangle versus open circle at the same [Ca2+]i (control).
Figure 8
Figure 8. Intracellular IP3 differentially affects single TRPC7 and TRPC6 channel activity
A, typical trace (lower panel) and corresponding NPoversus time plot (upper panel) for CCh-activated TRPC7 channel activity at two different [Ca2+]i values (< 10 nm and 0.11 μm) with IP3 (10 μm) or wild-type CaM (1 μm). I/O recording at −60 mV. B, summary of the effects of Ca2+i, IP3 (10 μm) or CaM (1 μm) on single TRPC7 and TRPC6 channel activity evaluated from experiments such as shown in A. n = 5–8. C, typical examples of OAG (100 μm)-induced ITRPC6 at −60 mV with (lower panel) or without (upper panel) a subthreshold activating concentration of CCh (0.5 μm). D, summary of the effects of intracellular IP3 (10 μm; added in the pipette) or a subthreshold concentration of CCh (0.5 μm) on ITRPC6 and ITRPC7. n = 5–7. In C and D, bath and pipette contained 1 mm Ca2+-containing external and 0.1 EGTA internal solutions, respectively. *P < 0.05 with unpaired t test or ANOVA and pooled variance t test.
Figure 9
Figure 9. PKC mediates inactivation of TRPC6 and TRPC7 channels
A, representative records of CCh-evoked /TRPC6 with or without PKC inhibitory peptide (PKC-IP(19–36), 5 μm) in the pipette. B, effects of PKC inhibitors on the inactivation time of /TRPC690–50; see Fig. 1 legend); control (0.1 EGTA internal solution): pretreatment with calphostin C (500 nm, 5min, middle): intracellular perfusion of PKC-IP(19–36) (5 μm, 5min, right). n = 7–12. Recording conditions in A and B were the same as in Fig. 8C and D. C, effects of PKC inhibitors and activators on /TRPC6 or /TRPC7 density at two different [Ca2+]i levels. n = 5–12. *P < 0.05, **P < 0.01 with unpaired t test (in C) or ANOVA and pooled variance t test (in B).

Comment in

Similar articles

Cited by

References

    1. Albert AP, Large WA. Synergism between inositol phosphates and diacylglycerol on native TRPC6-like channels in rabbit portal vein myocytes. J Physiol. 2003;552:789–795. - PMC - PubMed
    1. Aromolaran AS, Albert AP, Large WA. Evidence for myosin light chain kinase mediating noradrenaline-evoked cation current in rabbit portal vein myocytes. J Physiol. 2000;524:853–863. - PMC - PubMed
    1. Aromolaran AS, Large WA. Comparison of the effects of divalent cations on the noradrenaline-evoked cation current in rabbit portal vein smooth muscle cells. J Physiol. 1999;520:771–782. - PMC - PubMed
    1. Boulay G. Ca2+-calmodulin regulates receptor-operated Ca2+ entry activity of TRPC6 in HEK-293 cells. Cell Calcium. 2002;32:201–207. - PubMed
    1. Boulay G, Brown DM, Qin N, Jiang M, Dietrich A, Zhu MX, Chen Z, Birnbaumer M, Mikoshiba K, Birnbaumer L. Modulation of Ca2+ entry by polypeptides of the inositol 1,4,5-trisphosphate receptor (IP3R) that bind transient receptor potential (TRP): evidence for roles of TRP and IP3R in store depletion-activated Ca2+ entry. Proc Natl Acad Sci U S A. 1999;96:14955–14960. - PMC - PubMed

Publication types

MeSH terms

LinkOut - more resources