MicroRNA expression detected by oligonucleotide microarrays: system establishment and expression profiling in human tissues
- PMID: 15574827
- PMCID: PMC534673
- DOI: 10.1101/gr.2845604
MicroRNA expression detected by oligonucleotide microarrays: system establishment and expression profiling in human tissues
Abstract
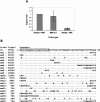
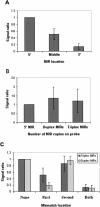
MicroRNAs (MIRs) are a novel group of conserved short approximately 22 nucleotide-long RNAs with important roles in regulating gene expression. We have established a MIR-specific oligonucleotide microarray system that enables efficient analysis of the expression of the human MIRs identified so far. We show that the 60-mer oligonucleotide probes on the microarrays hybridize with labeled cRNA of MIRs, but not with their precursor hairpin RNAs, derived from amplified, size-fractionated, total RNA of human origin. Signal intensity is related to the location of the MIR sequences within the 60-mer probes, with location at the 5' region giving the highest signals, and at the 3' end, giving the lowest signals. Accordingly, 60-mer probes harboring one MIR copy at the 5' end gave signals of similar intensity to probes containing two or three MIR copies. Mismatch analysis shows that mutations within the MIR sequence significantly reduce or eliminate the signal, suggesting that the observed signals faithfully reflect the abundance of matching MIRs in the labeled cRNA. Expression profiling of 150 MIRs in five human tissues and in HeLa cells revealed a good overall concordance with previously published results, but also with some differences. We present novel data on MIR expression in thymus, testes, and placenta, and have identified MIRs highly enriched in these tissues. Taken together, these results highlight the increased sensitivity of the DNA microarray over other methods for the detection and study of MIRs, and the immense potential in applying such microarrays for the study of MIRs in health and disease.
Figures


Similar articles
-
Distinctive microRNA expression in early stage nasopharyngeal carcinoma patients.J Cell Mol Med. 2016 Dec;20(12):2259-2268. doi: 10.1111/jcmm.12906. Epub 2016 Aug 4. J Cell Mol Med. 2016. PMID: 27489139 Free PMC article.
-
Discovery and profiling of bovine microRNAs from immune-related and embryonic tissues.Physiol Genomics. 2007 Mar 14;29(1):35-43. doi: 10.1152/physiolgenomics.00081.2006. Epub 2006 Nov 14. Physiol Genomics. 2007. PMID: 17105755
-
Micro-RNA profiling in kidney and bladder cancers.Urol Oncol. 2007 Sep-Oct;25(5):387-92. doi: 10.1016/j.urolonc.2007.01.019. Urol Oncol. 2007. PMID: 17826655
-
Nutrition, microRNAs, and Human Health.Adv Nutr. 2017 Jan 17;8(1):105-112. doi: 10.3945/an.116.013839. Print 2017 Jan. Adv Nutr. 2017. PMID: 28096131 Free PMC article. Review.
-
Clinical outcome prediction by microRNAs in human cancer: a systematic review.J Natl Cancer Inst. 2012 Apr 4;104(7):528-40. doi: 10.1093/jnci/djs027. Epub 2012 Mar 6. J Natl Cancer Inst. 2012. PMID: 22395642 Free PMC article. Review.
Cited by
-
Global microRNA profiling in favorable prognosis subgroups of cancer of unknown primary (CUP) demonstrates no significant expression differences with metastases of matched known primary tumors.Clin Exp Metastasis. 2013 Apr;30(4):431-9. doi: 10.1007/s10585-012-9548-3. Epub 2012 Nov 4. Clin Exp Metastasis. 2013. PMID: 23124598 Clinical Trial.
-
MicroRNA expression profiling of single whole embryonic stem cells.Nucleic Acids Res. 2006 Jan 24;34(2):e9. doi: 10.1093/nar/gnj009. Nucleic Acids Res. 2006. PMID: 16434699 Free PMC article.
-
Cerebellar neurodegeneration in the absence of microRNAs.J Exp Med. 2007 Jul 9;204(7):1553-8. doi: 10.1084/jem.20070823. Epub 2007 Jul 2. J Exp Med. 2007. PMID: 17606634 Free PMC article.
-
circNBPF10/miR-224 Axis Regulates PBX3 to Promote the Malignant Progression of Lung Cancer.J Oncol. 2022 Mar 17;2022:2832920. doi: 10.1155/2022/2832920. eCollection 2022. J Oncol. 2022. PMID: 35342419 Free PMC article.
-
mRNA and microRNA expression profiles of the NCI-60 integrated with drug activities.Mol Cancer Ther. 2010 May;9(5):1080-91. doi: 10.1158/1535-7163.MCT-09-0965. Epub 2010 May 4. Mol Cancer Ther. 2010. PMID: 20442302 Free PMC article.
References
-
- Bartel, D.P. 2004. MicroRNAs: Genomics, biogenesis, mechanism, and function. Cell 116: 281-297. - PubMed
-
- Brennecke, J., Hipfner, D.R., Stark, A., Russell, R.B., and Cohen, S.M. 2003. bantam encodes a developmentally regulated microRNA that controls cell proliferation and regulates the proapoptotic gene hid in Drosophila. Cell 113: 25-36. - PubMed
-
- Calin, G.A., Sevignan, I.C., Dumitru, C.D., Hyslop, T., Noch, E., Yendamuri, S., Shimizu, M., Rattan, S., Bullrich, F., Negrini, M., et al. 2004. Human microRNA genes are frequently located at fragile sites and genomic regions involved in cancers. Proc. Natl. Acad. Sci. 101: 2999-3004. - PMC - PubMed
Web site references
-
- http://gene.genaco.com/miRNA.htm; description of the mirMASA technology.
-
- http://www.luminexcorp.com/01_xMAPTechnology/index.html; description of the xMAP technology.
Publication types
MeSH terms
Substances
LinkOut - more resources
Full Text Sources
Other Literature Sources
Miscellaneous
