. 2005 Feb;169(2):631-49.
doi: 10.1534/genetics.104.032334. Epub 2004 Oct 16.

Mutations that rescue the paralysis of Caenorhabditis elegans ric-8 (synembryn) mutants activate the G alpha(s) pathway and define a third major branch of the synaptic signaling network

Affiliations

Mutations that rescue the paralysis of Caenorhabditis elegans ric-8 (synembryn) mutants activate the G alpha(s) pathway and define a third major branch of the synaptic signaling network

Michael A Schade et al. Genetics. 2005 Feb.

Abstract

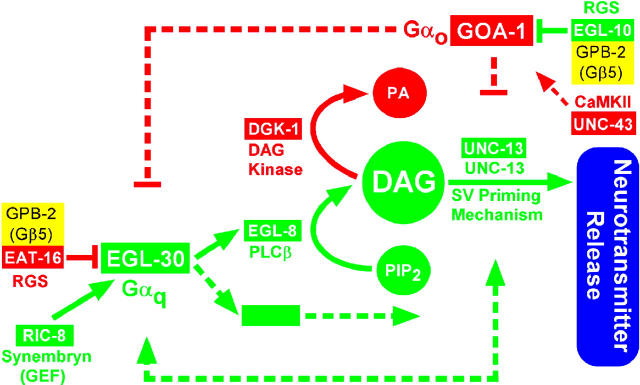
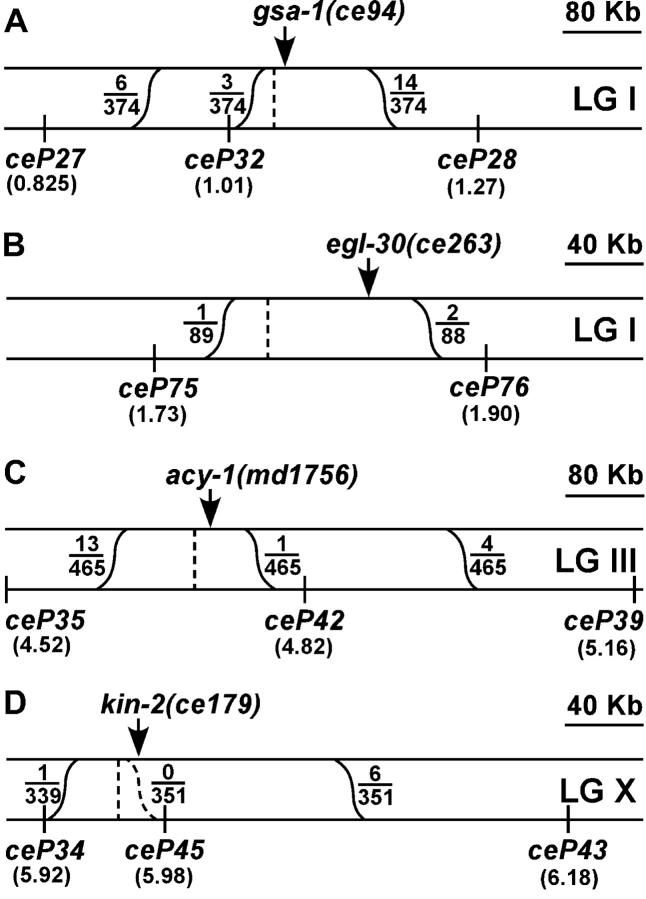
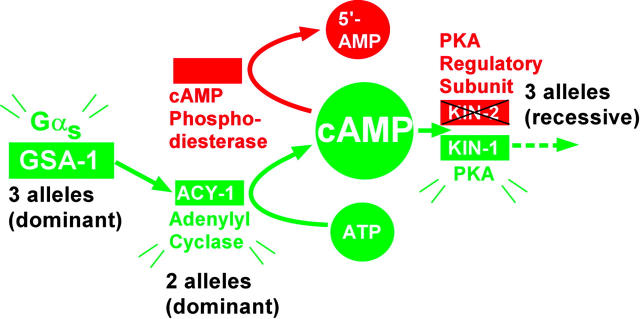
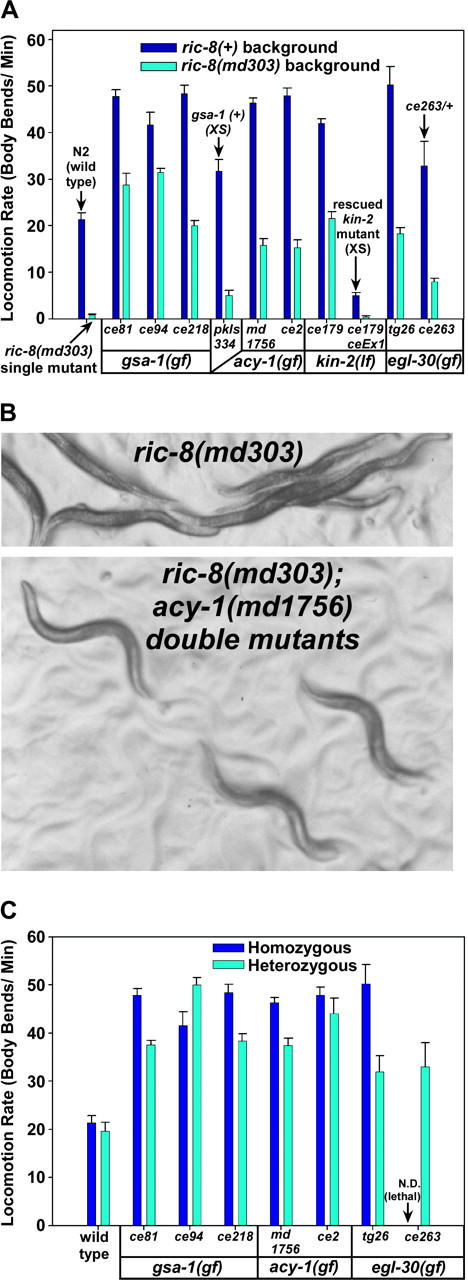
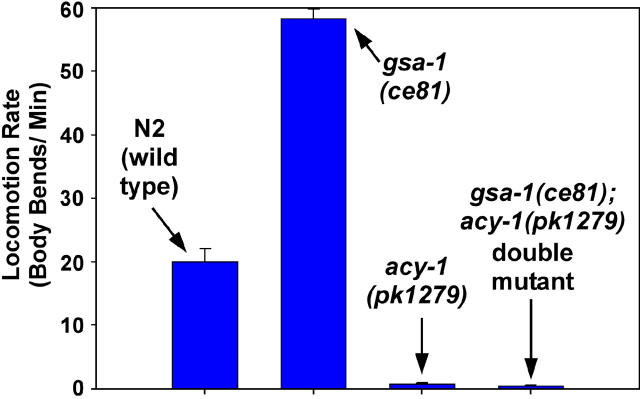
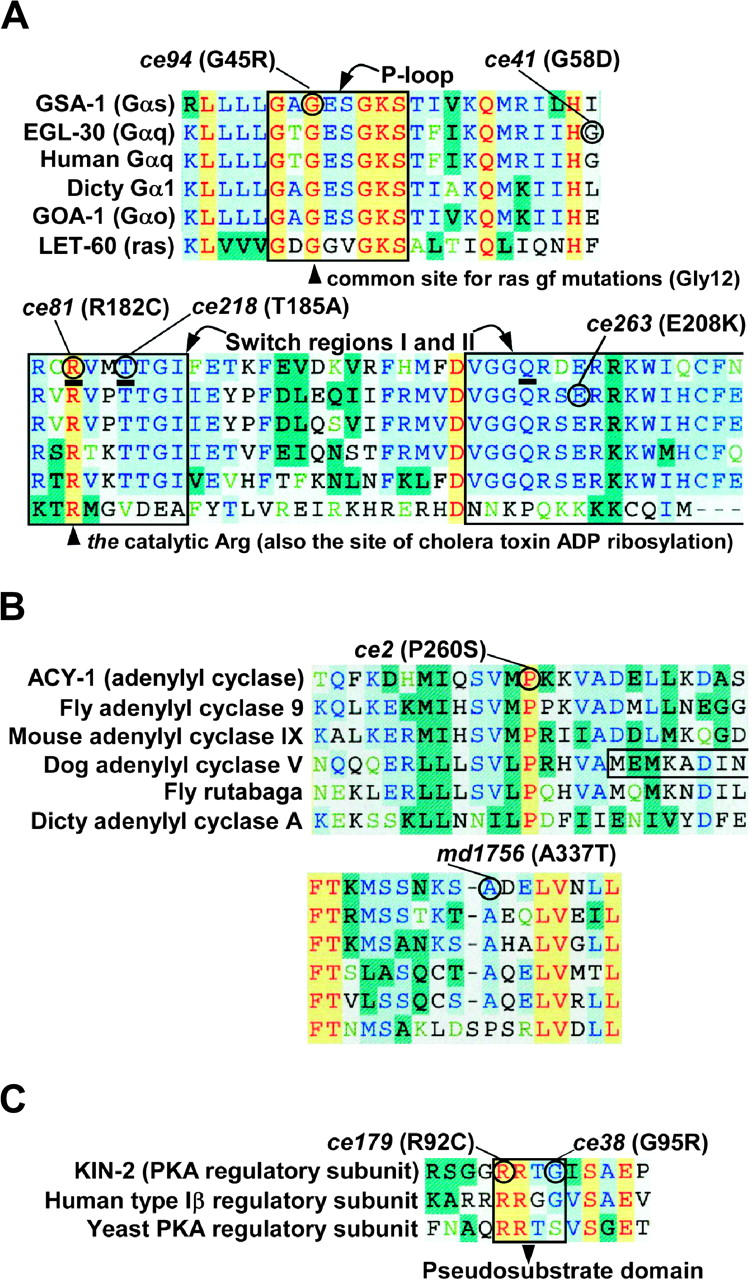
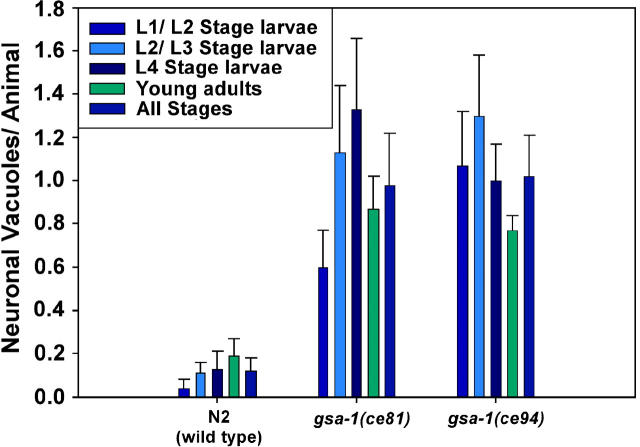
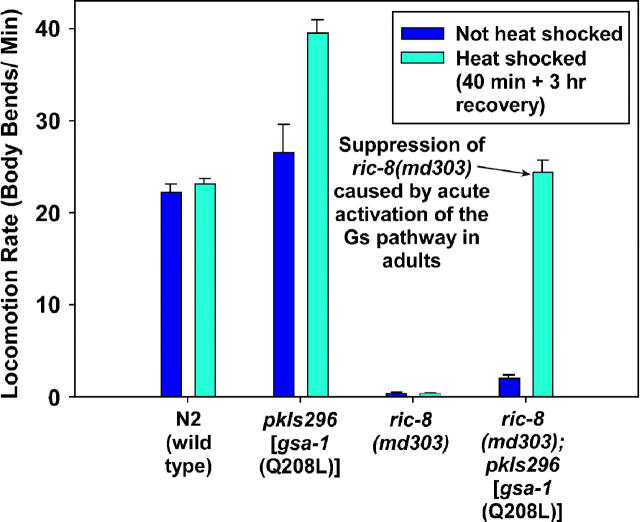
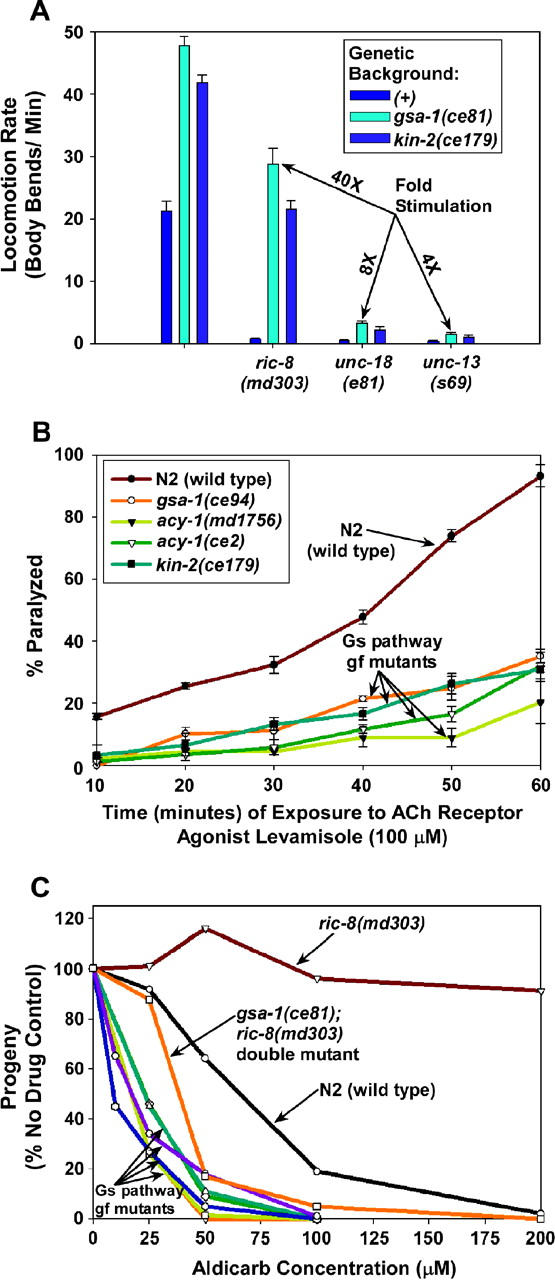
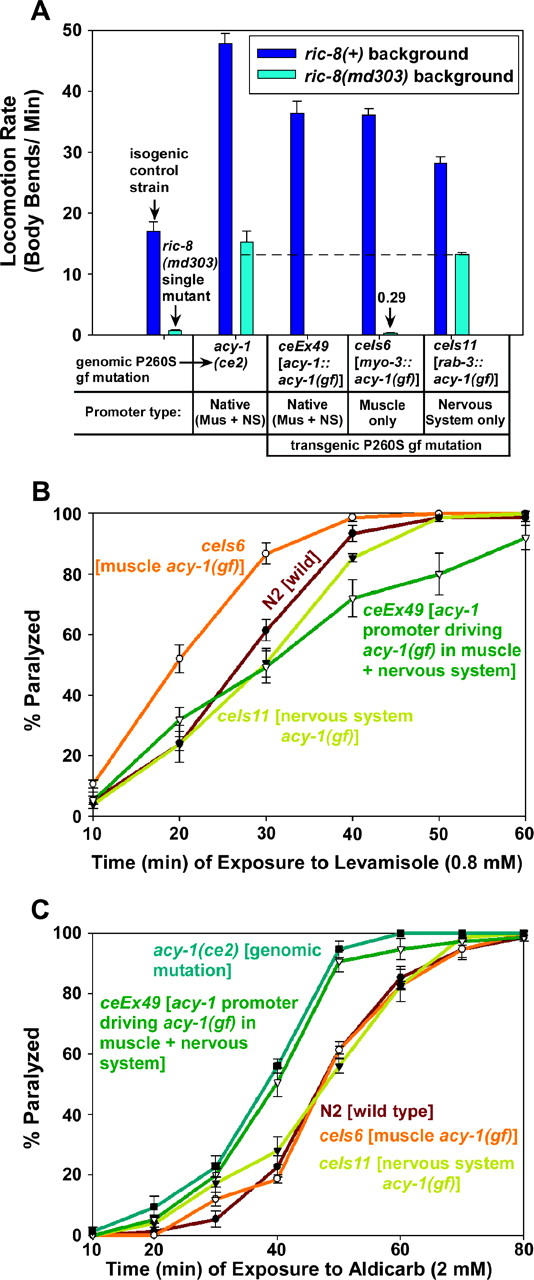
To identify hypothesized missing components of the synaptic G alpha(o)-G alpha(q) signaling network, which tightly regulates neurotransmitter release, we undertook two large forward genetic screens in the model organism C. elegans and focused first on mutations that strongly rescue the paralysis of ric-8(md303) reduction-of-function mutants, previously shown to be defective in G alpha(q) pathway activation. Through high-resolution mapping followed by sequence analysis, we show that these mutations affect four genes. Two activate the G alpha(q) pathway through gain-of-function mutations in G alpha(q); however, all of the remaining mutations activate components of the G alpha(s) pathway, including G alpha(s), adenylyl cyclase, and protein kinase A. Pharmacological assays suggest that the G alpha(s) pathway-activating mutations increase steady-state neurotransmitter release, and the strongly impaired neurotransmitter release of ric-8(md303) mutants is rescued to greater than wild-type levels by the strongest G alpha(s) pathway activating mutations. Using transgene induction studies, we show that activating the G alpha(s) pathway in adult animals rapidly induces hyperactive locomotion and rapidly rescues the paralysis of the ric-8 mutant. Using cell-specific promoters we show that neuronal, but not muscle, G alpha(s) pathway activation is sufficient to rescue ric-8(md303)'s paralysis. Our results appear to link RIC-8 (synembryn) and a third major G alpha pathway, the G alpha(s) pathway, with the previously discovered G alpha(o) and G alpha(q) pathways of the synaptic signaling network.


Figures

F<sc>igure</sc> 1.—
Figure 1.—
Pathway model of the Gαo-Gαq signaling network as inferred from C. elegans genetic studies. Solid lines indicate that direct interactions are known or likely, while dashed lines and/or large gaps between line endpoints and downstream effectors indicate predicted interactions or missing components. Proteins that positively regulate neurotransmitter release are shown in green. Reducing green protein function results in aldicarb resistance, paralysis or decreased locomotion, decreased egg laying, and, in some cases, paralytic larval arrest. Proteins that inhibit neurotransmitter release are shown in red blocks. Reducing red protein function results in aldicarb hypersensitivity and increased rates of locomotion and egg laying. The bottom green dashed lines represent hypothetical components (searched for using the genetic screens herein) that could positively regulate the EGL-30 (Gαq) pathway to establish or maintain synapse activation. This model is based on the following studies: Maruyama and Brenner (1991), Mendel et al. (1995), Segalat et al. (1995), Brundage et al. (1996), Koelle and Horvitz (1996), Hajdu-Cronin et al. (1999), Lackner et al. (1999), Miller et al. (1999)(2000), Nurrish et al. (1999), Richmond et al. (1999)(2001), Robatzek and Thomas (2000), Chase et al. (2001), Robatzek et al. (2001), van der Linden et al. (2001), Bastiani et al. (2003), and Tall et al. (2003).
F<sc>igure</sc> 2.—
Figure 2.—
Summary of SNP fine-mapping data for four new synaptic signaling network mutations. (A–D) Regions of 320 kb (B and D) or 640 kb (A and C) near each mutation. The chromosome on which each mutation resides is indicated on the right as LG I, III, or X. The top strand represents the mutant chromosome, and the bottom strand represents the CB4856 chromosome containing the indicated SNP markers. This is the expected arrangement of the two chromosomes during the crossing-over stage of meiosis when recombination could occur. Sinusoidal lines represent recombination events that could place the mutation on the same chromosome as an SNP marker. Fractions represent the number of actual recombination events, inferred from SNP mapping data, over the total number of homozygous mutant lines tested. The vertical dashed line in A–D represents the predicted location of each mutation, which we extrapolated from the fraction of recombination events that occurred on each side of the mutation. The arrow in A–D points to the actual location of the mutation based on sequencing studies described herein. The numbers in parentheses under each SNP marker indicate the distance of each marker, in units of millions of base pairs, from the left end of the chromosome (taken from WormBase Release WS91). We also mapped the other six ric-8 suppressor mutations that were analyzed in this study as follows: ce81 and ce218 both map to the same region as ce94, between ceP27 and ceP28 (A); ce41 maps to the same interval as ce263, between ceP75 and ceP76 (B); ce2 maps to the same region as md1756, between ceP35 and ceP39 (C); and ce38 and ce151 fail to complement ce179 (D) and show tight linkage to ce179 (no wild-type progeny observed among progeny of ce179/ce38). See Table 1 for details of the SNP markers shown in this figure.
F<sc>igure</sc> 3.—
Figure 3.—
Pathway model of the C. eleganss pathway. Shown are the C. elegans orthologs of the canonical Gαs pathway that are relevant to this study, arranged as originally defined by vertebrate biochemical studies, which is consistent with this study and previous C. elegans genetic studies (Berger et al. 1998; Korswagen et al. 1998). According to the model, GSA-1 (Gαs)'s action is mediated, in whole or part, by its major effector molecule ACY-1. ACY-1 produces the small signaling molecule cAMP. The binding of cAMP to KIN-2 (a PKA regulatory subunit) leads to its dissociation from the inactive holoenzyme and the release of active KIN-1 (a PKA catalytic subunit). Other potential effectors of cAMP are not shown. cAMP action is terminated by one or more cAMP phosphodiesterases (not identified). Activating green proteins or reducing the function of red proteins suppresses ric-8(md303). For each component, the number of alleles that this study identified is indicated, along with allele type (dominant or recessive).
F<sc>igure</sc> 4.—
Figure 4.—
Mutations that activate the Gαs or Gαq pathways strongly suppress the paralysis of ric-8(md303) mutants and cause hyperactive locomotion in a ric-8(+) background. (A) Shown are the mean locomotion rates, expressed as body bends per minute, of strains carrying various mutations that activate the Gαs or Gαq pathways. egl-30(tg26) was isolated in a previous study (Doi and Iwasaki 2002). Dark-blue bars represent the mutants in a ric-8(+) (wild type for ric-8) background, while cyan bars represent double mutants carrying the indicated mutations in a ric-8(md303) (strong reduction-of-function) background. For comparison, wild-type animals (N2) and ric-8(md303) single mutants are shown in the first set of two bars, as indicated. Allele names are indicated and are grouped according to the affected genes. Allele types [gain of function (gf) or loss of function (lf)] are indicated for each gene. The two strongest gsa-1 gf mutations improve the locomotion rate of ric-8(md303) mutants ∼40-fold and confer significantly hyperactive locomotion even in a ric-8(md303) background (in comparisons of N2 wild type vs. gsa-1(ce94); ric-8(md303) or gsa-1(ce81); ric-8(md303) double mutants, the P-values are <0.0001 and 0.0222, respectively, using the unpaired t-test with Welch correction). Strains carrying transgenic arrays that overexpress gsa-1(+) or kin-2(+) are indicated with arrows and the annotation “XS.” Note that overexpression of the kin-2(+) gene in either the ric-8(+) or the ric-8(md303) background rescues the kin-2 loss-of-function locomotion phenotype and confers sluggish locomotion. As indicated, the egl-30 gain-of-function mutation ce263 has been assayed only as a heterozygote in the ric-8(+) background, because heterozygotes are larval lethals. Not included are data for two weaker alleles of kin-2 (ce38 and ce151) and one weaker gain-of-function allele of egl-30(ce41). Error bars represent the standard error of the mean for 8–10 animals. See also supplemental QuickTime movies for Figure 4 at http://www.genetics.org/supplemental/. (B) Images comparing the posture and movement of ric-8(md303) single mutants and ric-8(md303); acy-1(md1756) double mutants. While ric-8(md303) mutants exhibit a relatively flat waveform and a straight, paralyzed posture, the double mutants exhibit postures not readily distinguishable from wild type (not shown). (C) Mutants carrying gain-of-function mutations in the Gαs or Gαq pathways exhibit strong dominance. Shown are the mean locomotion rates, expressed as body bends per minute, of strains carrying various mutations that activate the Gαs or Gαq pathways. Dark blue and cyan bars represent animals homozygous or heterozygous, respectively, for the indicated mutations. All heterozygotes are also heterozygous for dpy-5(e61), which was used as a recessive marker mutation to identify heterozygotes. For comparison, wild type (N2) and dpy-5(e61)/+ are shown in the first set of two bars. Allele names are indicated and are grouped according to the affected genes. Note that all of these mutations confer significantly hyperactive locomotion even in heterozygous strains (highest P-value for any strain when compared to wild type is 0.051 for the egl-30(ce263)/+ mutant). Note that mutants carrying the gsa-1(ce94) mutation are significantly more hyperactive as heterozygotes than as homozygotes (P = 0.021). The notation “ce263/+” indicates that the egl-30(ce263) gain-of-function mutation has not been assayed in a homozygous state outside of the ric-8(md303) background in which we isolated it (because strains heterozygous for this mutation in a ric-8(+) background do not reach adulthood). Error bars represent the standard error of the mean for 10 animals. Statistical comparisons use the unpaired t-test with Welch correction.
F<sc>igure</sc> 5.—
Figure 5.—
s is completely dependent on adenylyl cyclase to regulate locomotion rate. Shown are the mean locomotion rates, expressed as body bends per minute, of the wild-type strain and strains carrying the gsa-1(ce81) and/or acy-1(pk1279) mutations. Error bars represent the standard error from populations of 8–10 larvae (each 6–30 hr old).
F<sc>igure</sc> 6.—
Figure 6.—
Molecular analysis of ric-8(md303) suppressor mutations reveals both known and novel gain-of-function mutations in the Gαs and Gαq pathways. (A) Gain-of-function mutations in GSA-1 (Gαs) and EGL-30 (Gαq) disrupt residues critical for GTP hydrolysis. Shown are amino acid sequence alignments of two regions relevant to the Gα mutations described herein. Residues that are identical in all six proteins are highlighted yellow, those identical in five of six are highlighted light blue, and other colors indicate various degrees of less-conserved residues. The boxed area labeled “P-loop” in the upper alignment indicates the boundaries of the phosphate-binding loop that binds the βγ phosphates of GTP (Vetter and Wittinghofer), which is thought to participate in stabilizing a pentavalent intermediate of GTP hydrolysis (Sondek et al. 1994). Boxes in the lower alignment delineate the boundaries of two of the three moveable switch elements that are directly involved in GTP hydrolysis, as defined by Sunahara et al. (1997). The three residues underlined in the GSA-1 (Gαs) sequence correspond to residues proposed to form the pentavalent intermediate active site for GTP hydrolysis (Sondek et al. 1994). GSA-1 (Gαs) and EGL-30 (Gαq) gain-of-function mutations identified in this study are circled, and the specific amino acid change is stated. Note that two of the three gsa-1 gain-of-function mutations identified in this study change active site residues. Arrowheads point to amino acids corresponding to a common site of ras gain-of-function mutations (which is the same residue mutated in gsa-1(ce94)) and the catalytic arginine that is ADP ribosylated by cholera toxin, which is mutated in gsa-1(ce81)). Accession numbers for the six proteins (from top to bottom) are GI:2443297, U56864, P50148, M25060, M38251, and A36290. (B) Gain-of-function mutations in ACY-1 change conserved residues in the C1 catalytic domain. Shown are amino acid sequence alignments of two regions in adenylyl cyclase's C1 catalytic domain that are relevant to the mutations described herein. The aligned sequences in each region, as indicated, include C. elegans ACY-1, mouse and fly orthologs of ACY-1 (known as type IX adenylyl cyclase), dog adenylyl cyclase V, the fly rutabaga gene product, and Dictystelium adenylyl cyclase A. A three-sided box in the dog adenylyl cyclase V sequence indicates the start of the C1 region that was used for a previous structural study (Tesmer et al. 1997). Note that the ce2 gain-of-function mutation changes an absolutely conserved Pro residue near the beginning of the C1 domain. The md1756 mutation changes a conserved Ala residue that corresponds to a known contact point between the C1 and C2 domains, as revealed by structural studies (Tesmer et al. 1997; Zhang et al. 1997). Accession numbers for the six proteins (from top to bottom) are CAA84795, AF005630, AAC52603, M88649, M81887, and Q03100. (C) Strong reduction-of-function mutations in KIN-2 (regulatory subunit of protein kinase A) change conserved residues in the small, inhibitory pseudosubstrate domain. Shown is an amino acid sequence alignment centered around the pseudosubstrate domain. The aligned sequences include C. elegans KIN-2, its human ortholog (type Iβ PKA regulatory subunit), and the yeast PKA regulatory subunit. Both the ce179 and the ce38 mutations fall within the four-amino-acid boxed region known as the pseudosubstrate domain. The kin-2(ce151) mutation (E137K; not shown) falls outside of the region shown. Note that the ce179 mutation changes an absolutely conserved Arg. Accession numbers for the three proteins (from top to bottom) are P30625, P31321, and NC_001141.
F<sc>igure</sc> 7.—
Figure 7.—
Native gain-of-function mutations do not cause widespread neuronal death. Shown is the average number of neuronal vacuoles per animal in wild type and in our two strongest gsa-1 gain-of-function mutants. The results show that these mutants have significantly more neuronal vacuoles than wild type (the P-values are 0.0002 and <0.0001 for comparing N2 to gsa-1(ce81) and gsa-1(ce94), respectively, using the unpaired t-test with Welch correction); however, the level of neuronal death amounts to, on average, only ∼1 of ∼300 nerve cells in each animal. Also note that the number of neuronal vacuoles did not significantly increase as the mutants developed into young adults. Error bars represent the standard error of the means for a sample size of 10 animals.
F<sc>igure</sc> 8.—
Figure 8.—
Activating the Gαs pathway suppresses ric-8(md303) and causes hyperactive locomotion by inducing rapid functional changes. A transgenic array carrying the gsa-1 Q208L gain-of-function mutation under control of a heat-shock-inducible promoter [HS::gsa-1(Q208L)] suppresses ric-8(md303) only 3 hr after a 40-min heat-shock treatment. Dark blue and cyan bars indicate locomotion rates without or with heat-shock treatment, respectively. Note that the heat-shock induction of gsa-1 (Q208L) improves the locomotion rate of ric-8(md303) ∼13-fold relative to non-heat-shock conditions, whereas heat-shock treatment of control strains does not improve locomotion rate. Heat-shock induction of gsa-1 (Q208L) in a ric-8(+) background causes significantly hyperactive locomotion. The slightly improved locomotion rate associated with the array under non-heat-shock conditions (relative to control strains) may indicate that the promoter is not completely off under non-heat-shock conditions. Error bars represent the standard error of the mean for eight animals. See also supplemental QuickTime movies for Figure 8 at http://www.genetics.org/supplemental/.
F<sc>igure</sc> 9.—
Figure 9.—
The hyperactivated Gαs pathway increases neurotransmitter release and requires the synaptic vesicle priming protein UNC-13 to exert its effects on locomotion. (A) Activating the Gαs pathway does not strongly suppress the near-paralysis of mutants with reduced synaptic vesicle docking and priming. Shown are the mean locomotion rates, expressed as body bends per minute, of various strains. Strains homozygous for ric-8(md303), unc-18(e81), or unc-13(s69) are grouped together as indicated. Dark-blue bars within each set represent strains carrying no additional mutations (genetic background (+)). Cyan bars represent double mutants in which the second mutation is gsa-1(ce81), and royal blue bars represent double mutants in which the second mutation is kin-2(ce179). The first group of bars (unlabeled) represents wild-type and single-mutant control strains. “Fold stimulation” calculations are shown only for double mutants carrying the gsa-1(ce81) mutation. Error bars represent the standard error of the mean for 8–10 animals. See also supplemental QuickTime movies for Figure 9 at http://www.genetics.org/supplemental/. (B) Mutants with an activated Gαs pathway show reduced sensitivity to the ACh receptor agonist levamisole. The graph compares the percentage of animals that are paralyzed, over a time course, in a solution of 100 μm levamisole. Note that all of the mutants with an activated Gαs pathway are significantly resistant to the paralytic effects of levamisole (all P-values are <0.014 for any strain compared to wild type at any time point). This indicates that their hyperactive behavior is not the result of increased sensitivity of the muscle to ACh. Similar results were obtained using 1200 μm nicotine (solution assay) and 800 μm levamisole (solid media assay; data not shown). Error bars represent standard error of the means for three experiments. (C) Hyperactivation of the Gαs pathway causes hypersensitivity to aldicarb. The graph compares the population growth rates of strains with various concentrations of aldicarb. One hundred percent represents the number of progeny produced from a starting population of L1 larvae over a 96-hr period in the absence of aldicarb (carrier only). Note that ric-8(md303) is strongly resistant to aldicarb (indicating decreased neurotransmitter release); however, activating the Gαs pathway in the ric-8 mutant background seems to restore neurotransmitter release to at least wild-type levels, if not greater, since the gsa-1(ce81); ric-8(md303) double mutant is hypersensitive to aldicarb. Note that all of the mutants with an activated Gαs pathway (designated “Gs pathway gf mutants”) are hypersensitive to aldicarb as single mutants. Mutants included in the cluster designated “Gs pathway gf mutants” are as follows (from left to right at the 40% level): kin-2(ce179), gsa-1(ce94), gsa-1(ce81) (superimposed on ce94), kin-2(ce38), acy-1(ce2), and acy-1(md1756) (superimposed on ce2). Curves are representative of duplicate experiments.
F<sc>igure</sc> 10.—
Figure 10.—
Suppression of ric-8(md303) occurs via the neuronal Gαs pathway, but both the muscle and the nervous system Gαs pathway contribute to the locomotion rate and drug sensitivity phenotypes. (A) Hyperactivation of the Gαs pathway in either muscle or nervous system is sufficient to confer hyperactive locomotion; hyperactivation of the Gαs pathway in the nervous system, but not muscle, significantly suppresses the paralysis of ric-8(md303). Shown are the mean locomotion rates of various strains, expressed as body bends per minute. Dark-blue bars represent a ric-8(+) (wild type for ric-8) background, while light-blue bars represent a ric-8(md303) strong reduction-of-function background. For comparison, the isogenic control strain and the ric-8(md303) single mutant are shown in the first set of two bars, as indicated. All remaining bars represent strains carrying the acy-1 (P260S) gain-of-function mutation either in the form of the ce2 genomic mutation or on trangenes driven by various promoters, as indicated. All transgenic strains in this figure, including the isogenic control strain, are in the pha-1(e2123) background rescued with the pha-1(+) gene, which was used as a selectable marker for transformants. Error bars represent the standard error of the mean for 8–10 animals. (B) Both the muscle and the nervous system Gαs pathways contribute to the levamisole resistance phenotype. The graph compares the percentage of animals that are paralyzed, over a time course, on plates containing 800 μm levamisole. Note that a transgene that expresses the same mutation (P260S) under control of the native acy-1 promoter appears to cause slight resistance to the paralytic effects of levamisole (P = 0.12 and 0.09 for the 40- and 50-min time points, respectively). However, the same mutation expressed only in body-wall muscle confers significant hypersensitivity to levamisole (P = 0.032 and 0.0071 for the 20- and 30-min time points, respectively), and when expressed only in the nervous system, it either does not significantly alter levamisole sensitivity or causes slight resistance (P = 0.17 and 0.11 for the 30- and 40-min time points, respectively). Error bars represent standard error of the means for three experiments. (C) Expressing the acy-1 (P260S) gain-of-function mutation only in muscle or only in nervous system does not significantly alter overall levels of neurotransmitter release. The graph compares the percentage of animals that are paralyzed, over a time course, on plates containing 2 mm aldicarb. Note that both the genomic acy-1(ce2) mutation and a transgene that expresses the same mutation (P260S) under control of the native acy-1 promoter cause significant hypersensitivity to aldicarb (P = 0.0055 and 0.022 for each strain, respectively, at the 50-min time point). However, when the same mutation is expressed only in body-wall muscle or only in the nervous system, aldicarb sensitivity is not significantly altered. Similar results were obtained using the population growth method of measuring aldicarb sensitivity (data not shown). Error bars represent standard error of the means for three experiments.

Similar articles

Cited by

References

    1. Ahnert-Hilger, G., T. Schäfer, K. Spicher, C. Grund, G. Schultz et al., 1994. Detection of G-protein heterotrimers on large dense core and small synaptic vesicles of neuroendocrine and neuronal cells. Eur. J. Cell Biol. 65: 26–38. - PubMed
    1. Aravamudan, B., T. Fergestad, W. S. Davis, C. K. Rodesch and K. Broadie, 1999. Drosophila Unc-13 is essential for synaptic transmission. Nat. Neurosci. 2(11): 965–971. - PubMed
    1. Aronin, N., and M. DiFiglia, 1992. The subcellular localization of the G-protein Giα in the basal ganglia reveals its potential role in both signal transduction and vesicle trafficking. J. Neurosci. 12(9): 3435–3444. - PMC - PubMed
    1. Augustin, I., C. Rosenmund, T. C. Südhof and N. Brose, 1999. Munc13–1 is essential for fusion competence of glutamatergic synaptic vesicles. Nature 400: 457–461. - PubMed
    1. Bastiani, C. A., S. Gharib, M. I. Simon and P. W. Sternberg, 2003. Caenorhabditis elegans Gαq regulates egg-laying behavior via a PLCβ-independent and serotonin-dependent signaling pathway and likely functions both in the nervous system and in muscle. Genetics 165: 1805–1822. - PMC - PubMed

Publication types

MeSH terms

LinkOut - more resources