Comparative Study
. 2004 Oct 15;18(20):2491-505.
doi: 10.1101/gad.1228804. Epub 2004 Oct 1.

A dynamic transcriptional network communicates growth potential to ribosome synthesis and critical cell size

Affiliations
Comparative Study

A dynamic transcriptional network communicates growth potential to ribosome synthesis and critical cell size

Paul Jorgensen et al. Genes Dev. .

Abstract

Cell-size homeostasis entails a fundamental balance between growth and division. The budding yeast Saccharomyces cerevisiae establishes this balance by enforcing growth to a critical cell size prior to cell cycle commitment (Start) in late G1 phase. Nutrients modulate the critical size threshold, such that cells are large in rich medium and small in poor medium. Here, we show that two potent negative regulators of Start, Sfp1 and Sch9, are activators of the ribosomal protein (RP) and ribosome biogenesis (Ribi) regulons, the transcriptional programs that dictate ribosome synthesis rate in accord with environmental and intracellular conditions. Sfp1 and Sch9 are required for carbon-source modulation of cell size and are regulated at the level of nuclear localization and abundance, respectively. Sfp1 nuclear concentration responds rapidly to nutrient and stress conditions and is regulated by the Ras/PKA and TOR signaling pathways. In turn, Sfp1 influences the nuclear localization of Fhl1 and Ifh1, which bind to RP gene promoters. Starvation or the absence of Sfp1 causes Fhl1 and Ifh1 to localize to nucleolar regions, concomitant with reduced RP gene transcription. These findings suggest that nutrient signals set the critical cell-size threshold via Sfp1 and Sch9-mediated control of ribosome biosynthetic rates.


Figures

Figure 1.
Figure 1.
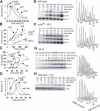
Sch9 and Sfp1 regulate cell size and RP and Ribi regulon transcription. (A) Galactose-regulated alleles of SFP1 and SCH9. (B) Inactivation of an analog-sensitive (as) allele of SCH9 by 1NM-PP1. A total of 100 nM 1NM-PP1 or DMSO solvent was added at 0 min to log phase, glucose cultures of sch9as and sch9Δ. Cell-size distributions were measured after 6 h and compared with reference distributions. Without 1NM-PP1, the sch9as allele is hypomorphic, with nearly wild-type doubling time (td), but a strong Whi phenotype (td: 96 min, median cell size: 30 fL, vs. 87 min, 42 fL for wild type and 153 min, 28 fL for sch9Δ). (C) Sch9 and Sfp1 activate the RP and Ribi regulons. Expression profiles for GAL1–SFP1 and sfp1Δ/Δ were repetitions of experiments described previously (Jorgensen et al. 2002). Expression profiles were determined for sch9as and wild-type cultures harvested at indicated times after addition of 100 nM 1NM-PP1; expression ratios are relative to untreated cells from the same culture. The presence of RAP1, PAC, RRPE, or PAC + RRPE (P+R) promoter elements is indicated (Pilpel et al. 2001; Jorgensen et al. 2002). (D) Induction of representative genes in the Ribi (NOP1, NSR1) and RP (RPPO, RPL11B) regulons upon restoration of GAL1–SCH9 or GAL1–SFP1 expression. An ACT1 loading control and GAL7, SFP1, and SCH9 induction controls are shown. (E) Comparison of gene sets regulated by Sfp1 and Sch9. Expression profiles of sfp1Δ/Δ and inactivated sch9as (1NM-PP1, 90 min) were plotted against one another. The number of genes in each functional group is indicated.
Figure 2.
Figure 2.
Sfp1 and Sch9 are negative regulators of Start. (A) Size distributions of sfp1Δ and sch9Δ strains. Doubling times were as follows: sfp1Δ 220 ± 13 min, sch9Δ 153 ± 3 min, wild type (WT) 89 ± 2 min, wild type (WT) + 200 nM cycloheximide 149 ± 4 min. (B–H) Determination of critical cell size. Small G1-phase daughter cells (>97% unbudded) were isolated from late log-phase cultures (3–4 × 10⁷ cells/mL, raffinose medium with no drugs) of wild-type, sfp1Δ and sch9as strains by centrifugal elutriation and reinoculated in glucose medium. A total of 100 nM 1NM-PP1 was added to the sch9as culture upon reinoculation; 200 nM cycloheximide was added to a wild-type culture upon reinoculation. (B) Daughter cell size at various times after reinoculation for each culture. (C) Bud index as a function of cell size for each culture. (D) Cell-size distributions at the >25% budded time point for each culture. Passage through Start was monitored by cell size, bud index, and expression of SBF (CLN2)- and MBF (RNR1)-specific transcripts for wild-type cells (E), sch9as cells in 100 nM 1NM-PP1 (F), sfp1Δ cells (G), and wild-type cells in 200 nM cycloheximide (H). The time point at which cultures were >25% budded is highlighted in pink. All data was reproduced in duplicate experiments. 1NM-PP1 (100 nM) had no effect on the critical cell size of a wild-type strain (data not shown).
Figure 3.
Figure 3.
Cells lacking SFP1 or SCH9 fail to adjust cell size in response to carbon source. (A) Representative size distributions of log-phase cultures of the indicated strains in synthetic glucose (black), raffinose (blue), or glycerol (orange) medium. (B) Mean cell sizes of the indicated cultures (n = 6, range: 10–180 fL). Error bars extend one S.E. in each direction. The sfp1Δ/Δ GAL1–CLN3-1 (3-1) strain was propagated in synthetic galactose medium. (C) Nutrient and SFP1-dependent control of size in cells that lack known upstream regulators of SBF/MBF. Wild-type and cln3Δ bck2Δ whi5Δ strains were in rich glucose, raffinose, or glycerol medium. The sfp1Δ and sfp1Δ cln3Δ bck2Δ whi5Δ strains were in rich glucose medium. (D) Mean cell sizes of the indicated cultures (n ≥ 2, range: 10–180 fL). Error bars extend one S.E. in each direction.
Figure 4.
Figure 4.
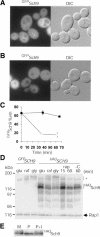
Sch9 abundance and localization is modulated by nutrients. (A) Enrichment of GFPSch9 at the vacuolar membrane (vm). (B) Depletion of GFPSch9 from the vm after carbon starvation (37 min). (C) Kinetics of GFPSch9 depletion from the vm. (Closed squares) +Glucose; (open diamonds) -glucose. Error bars extend one S.E. in each direction. (D) HA3Sch9 abundance and phosphorylation status are altered by nutrient conditions. Cells that expressed HA3SCH9 from the SCH9 promoter were propagated in rich glucose, raffinose, or glycerol medium. Cells propagated in glucose medium were treated with rapamycin (rap, 200 ng/mL) or carbon starved (-C). HA3Sch9 was visualized by immunoblot with anti-HA antibody. GFPSch9 served as a no-tag control. Asterisk indicates nonspecific cross-reactive species. (E) Sch9 is a phosphoprotein. HA3Sch9 expressed at endogenous levels was immunoprecipitated with anti-HA antibody and either mock treated (M), treated with alkaline phosphatase (P), or treated with alkaline phosphatase in the presence of phosphatase inhibitors (P+I) and detected by anti-HA immunoblotting.
Figure 5.
Figure 5.
Sfp1 nuclear concentration responds rapidly to environmental stimuli and is regulated by the Ras/PKA and TOR signaling pathways. (A) Sfp1 localization is regulated by nutrient signals. An SFP1YFP SEC63CFP strain was visualized; cell and nuclear membranes were demarcated by Sec63CFP. Carbon starvation (-C) was for 15 min, and rapamycin treatment (rap, 200 ng/mL) for 20 min. (B) Sfp1 exits the nucleus in response to various stress conditions. An SFP1YFP SEC63CFP strain was depleted for carbon or nitrogen or treated with H202 (0.30 mM), rapamycin (200 ng/mL), or tunicamycin (2 μg/mL). The Sfp1YFP nuclear:cytoplasmic ratio (N:C) of each cell at each time point was plotted (dashes, 30–100 cells), as was the average ratio (thick line). (C) Sfp1 abundance and electrophoretic mobility are not altered by carbon starvation (-C) or rapamycin (rap, 200 ng/mL) treatment. Cells were harvested after the indicated time (min). Sfp1MYC13 in cell lysates was visualized by immunoblot with anti-MYC antibody. Fhl1MYC13 served as a specificity control. (D) Sfp1 relocalization correlates withre-pression of the RP and Ribi regulons. Genome-wide expression profiles comparing mRNA abundance before and after carbon starvation (-C) were obtained de novo. Expression profiles for rapamycin addition (rap), oxidative stress (H202), and nitrogen starvation (-N) were derived from published data (Hardwick et al. 1999; Gasch et al. 2000). Scale indicates fold change. (E) Nuclear localization of Sfp1 in different carbon sources. The average Sfp1YFP N:C ratio was determined under steady-state proliferation in glucose, raffinose, and glycerol medium. Error bars extend one S.D. in each direction. (F) Sfp1 re-enters the nucleus rapidly in response to glucose. Stationary phase SFP1YFP SEC63CFP cells were re-fed with glucose in the presence or absence of cycloheximide (chx, 10 μM) and Sfp1YFP N:C ratios determined. (G) Sfp1 may effect a feedback response to ribosome shortage. Sfp1YFP N:C ratio was measured in SFP1YFP SEC63CFP cells proliferating in raffinose medium before and after addition of chx (10 μM). (H) The rapamycin-resistant allele TOR1-1 blocks Sfp1 relocalization in response to rapamycin but not nitrogen starvation. A TOR1-1 SFP1YFP strain was treated with rapamycin (red dotted line, 200 ng/mL) or starved for nitrogen (black, offset for visualization) for 30 min. (I) Compromised Ras activity lowers the nuclear concentration of Sfp1. The N:C ratio of Sfp1CFP was quantitated before and after 60 min of carbon starvation in a tpk1wimp strain (red dotted line, SFP1CFP tpk1wimp bcy1Δ tpk2Δ tpk3Δ) and in a control strain (black line, SFP1CFP, offset for visualization). At t = 0 min, the difference between the wild-type and wimp strain was significant (Student's t-test, p = 4.4 × 10⁻¹¹). Due to higher cell autofluorescence, Sfp1CFP N:C ratios are less than Sfp1YFP N:C ratios. (J) Hyperactive Ras signaling drives Sfp1 into the nucleus. A GAL10–RAS2V19 SFP1CFP strain (red dotted line) and a control SFP1CFP strain (black, offset for visualization), proliferating in synthetic raffinose medium, were induced with galactose at t = 0, and visualized after 30 and 60 min. Both strains were deleted for GAL1 and are incapable of metabolizing galactose.
Figure 6.
Figure 6.
Sfp1 and Sch9 function in parallel pathways. (A) sfp1Δ cells are sensitive to cycloheximide and to decreases in TOR or PKA pathway activity. (Left) Filter disks containing 3 nmole cycloheximide or 15 μg rapamycin were incubated on lawns of the indicated strains for 2 d. (Right) Synthetic proliferation defects between ras2Δ and sfp1Δ. Spore clones were scored after 4 d. (B) Sch9 does not control cell size strictly via Sfp1. Size distributions of an sfp1Δ/Δ strain in the presence or absence of a functionally null heterozygous GAL1–SCH9 (G9/+) allele are shown. Mean cell sizes of the indicated strains in either rich glucose or galactose medium are indicated to the right (n = 4). (C) An sfp1ER allele is modulated by β-estradiol (E2). Size distributions of log phase sfp1ER cultures with or without 250 nM E2 (left) or in the presence of various E2 concentrations (right). (D) Progressively compromised SCH9 and SFP1 activity reveals synergistic proliferation defects. An sch9as sfp1ER strain was inoculated into varying concentrations of 1NM-PP1 and E2 in synthetic glucose medium. Doubling times (td) were determined for each culture and the increase relative to cultures proliferating in 6.25 nM 1NM-PP1 and 125 nM E2 (concentrations at which Sch9as and Sfp1ER were fully active) was calculated. (Top) The increase in doubling time (Δtd) resulting from individually increasing 1NM-PP1 or decreasing E2 was used to calculate the predicted additive effects. Actual increases in doubling time (middle) and the difference (bottom) are plotted.
Figure 7.
Figure 7.
Sfp1 influences Fhl1 and Ifh1 interactions with RP promoters. (A) FHL1 deletion is epistatic to SFP1 deletion for colony size. Spore clones were imaged after 7 d (top) and 5 d (bottom). (B) FHL1 deletion is not epistatic to SFP1 deletion for cell size. Strains recently derived from a tetratype tetrad dissection (as in A) were sized in log phase in rich glucose medium. These representative distributions were highly reproducible. (C) Synthetic proliferation defects between sch9Δ and rgm1Δ and an allele of IFH1. Spore clones were imaged after 3 and 2 d, respectively. (D) Fhl1 and Ifh1 bind specifically to RP promoters. Real-time PCR was used to quantitate the efficiency with which the promoter regions of the indicated genes were captured in Fhl1HA3 (F7 anti-HA antibody) or Ifh1MYC13 (9E10 anti-MYC antibody) complexes. Binding to Ribi promoters (URA7, RPA190, NSR1) and control promoters (PGK1, ACT1) was not observed. (E) Ifh1MYC13 and Fhl1HA3 bind poorly to RP promoters in sfp1Δ cells. The sfp1Δ/wild-type ratio of ChIP efficiency for Ifh1MYC13 and Fhl1HA3 was calculated for two individual experiments. Error bars extend one S.E. in each direction.
Figure 8.
Figure 8.
Ifh1 and Fhl1 localize to the nucleolus in cells lacking SFP1 and upon carbon starvation. (A) An sfp1Δ IFH1CFP BUD21YFP strain and a control IFH1CFP BUD21YFP strain were visualized in glucose medium. Blue arrows indicate cells with nucleolar foci of Ifh1CFP. (B) An sfp1Δ FHL1YFP BUD21CFP strain and a control FHL1YFP BUD21CFP strain were visualized in glucose medium. Blue arrows indicate cells with nucleolar foci of Fhl1YFP. Wild-type and sfp1Δ cells are not presented to scale to improve the visualization of Fhl1YFP in the small nuclei and nucleoli of sfp1Δ cells. (C) Quantitation of Ifh1CFP and Fhl1YFP nucleolar foci. CFP and YFP fluorescence was visualized in a single plane in the indicated strains proliferating in glucose medium. If a clear nucleolar (Bud21Y/CFP) crescent or dot was evident in this plane, it was determined whether or not an adjacent or overlapping focus of Ifh1CFP or Fhl1YFP was present. (chx) Cells in 400 nM cycloheximide. For each condition, >165 in focus nucleoli were scored. (D) Ifh1CFP often relocalizes to the nucleolus upon carbon starvation. Carbon starvation was for 25 min (-C). Blue arrows indicate cells with nucleolar foci of Ifh1CFP. (E) Ifh1CFP nucleolar relocalization is rapid and sustained. At the indicated times after carbon starvation, Ifh1CFP and Bud21YFP fluorescence was visualized in five planes and the percentage of cells with nucleolar Ifh1CFP fluorescence determined. In total, 290 cells were analyzed. (F) Fhl1 relocalizes to a perinucleolar focus upon carbon starvation. Carbon starvation was for 55 min (-C). Blue arrows indicate cells with nucleolar foci of Fhl1YFP. (G) Fhl1YFP perinucleolar relocalization upon carbon starvation is rapid and sustained. Cells were resuspended in synthetic medium with (black squares) or without (gray diamonds) glucose. Images were processed as in C. At least 240 in-focus nucleoli were examined for each time course. (H) Carbon starvation does not dissociate Ifh1 or Fhl1 from RP promoters. ChIP efficiency was determined in glucose medium and after 30 min of carbon starvation. Average ratio of -/+ glucose ChIP efficiency was determined for two individual experiments. Error bars extend one S.E. in each direction.
Figure 9.
Figure 9.
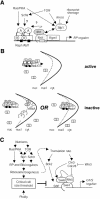
(A) Initial model for the transcription system at RP promoters. Sfp1 localization is controlled by various signals and in turn influences the localization of Ifh1 and Fhl1. As suggested by synthetic lethal interactions, Sch9 modulates RP transcription by a pathway parallel to Sfp1/Fhl1/Ifh1/Rgm1, perhaps by phosphorylating Rap1. Sfp1, Fhl1, and Rgm1 likely bind to the promoter directly via still uncharacterized sequence elements (gray box) (Warner 1999; Pilpel et al. 2001; Beer and Tavazoie 2004). Ifh1 and Fhl1 may activate RP transcription by switching Rap1 (or Abf1) between intrinsic transcriptional activation (A) and repressive (R) functions. (B) Summary of transcription factor localization correlated with active and inactive (carbon starvation) RP transcription. Two possible nonmutually exclusive models explain the nucleolar relocalization of Ifh1 and Fhl1 upon carbon starvation. (Left) In the first model, unbound Ifh1 and Fhl1 are sequestered in or near the nucleolus (nucl), where they may have additional functions, such as repressing rRNA transcription. In the second model, Ifh1 and Fhl1 and repressed RP promoters are drawn into the nucleolar region upon carbon starvation. (C) A model of Start entry. Ribosome synthesis rates and ploidy establish the critical cell size threshold, which represses the SBF and MBF transcription factor complexes by an unknown mechanism. Cell size or a parameter that correlates with size, such as translation rate, signals to Cln3 and/or Bck2 to activate SBF and MBF. The model is complicated by the effects of ribosome synthesis on translation and by increased Cln3 abundance in rich nutrient conditions (dashed line).

Similar articles

Cited by

References

    1. Amsterdam A., Sadler, K.C., Lai, K., Farrington, S., Bronson, R.T., Lees, J.A., and Hopkins, N. 2004. Many ribosomal protein genes are cancer genes in zebrafish. PLoS Biol. 2: 690-698. - PMC - PubMed
    1. Baroni M.D., Martegani, E., Monti, P., and Alberghina, L. 1989. Cell size modulation by CDC25 and RAS2 genes in Saccharomyces cerevisiae. Mol. Cell. Biol. 9: 2715-2723. - PMC - PubMed
    1. Baroni M.D., Monti, P., and Alberghina, L. 1994. Repression of growth-regulated G1 cyclin expression by cyclic AMP in budding yeast. Nature 371: 339-342. - PubMed
    1. Beer M.A. and Tavazoie, S. 2004. Predicting gene expression from sequence. Cell 117: 185-198. - PubMed
    1. Bishop A.C., Ubersax, J.A., Petsch, D.T., Matheos, D.P., Gray, N.S., Blethrow, J. Shimizu, E., Tsien, J.Z., Schultz, P.G., Rose, M.D., et al. 2000. A chemical switch for inhibitor-sensitive alleles of any protein kinase. Nature 407: 395-401. - PubMed

Publication types

MeSH terms

LinkOut - more resources