

Adjust quality scores from alignment and improve sequencing accuracy
- PMID: 15459287
- PMCID: PMC521663
- DOI: 10.1093/nar/gkh850
Adjust quality scores from alignment and improve sequencing accuracy
Abstract
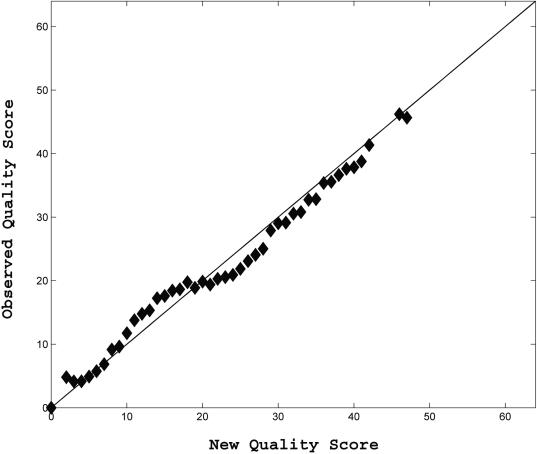
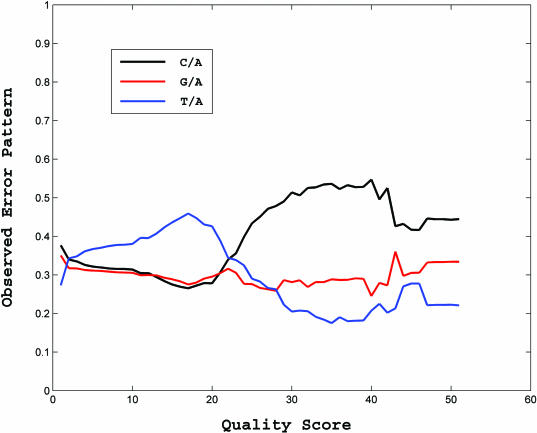
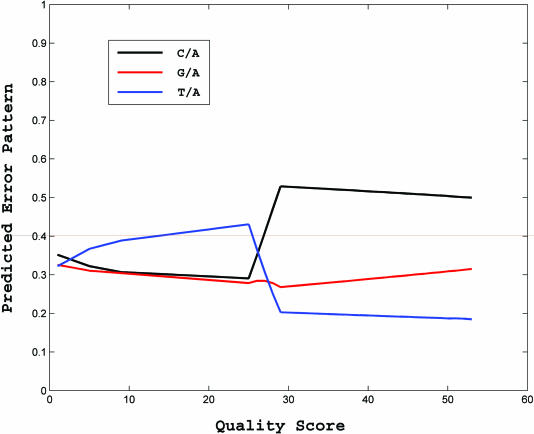
In shotgun sequencing, statistical reconstruction of a consensus from alignment requires a model of measurement error. Churchill and Waterman proposed one such model and an expectation-maximization (EM) algorithm to estimate sequencing error rates for each assembly matrix. Ewing and Green defined Phred quality scores for base-calling from sequencing traces by training a model on a large amount of data. However, sample preparations and sequencing machines may work under different conditions in practice and therefore quality scores need to be adjusted. Moreover, the information given by quality scores is incomplete in the sense that they do not describe error patterns. We observe that each nucleotide base has its specific error pattern that varies across the range of quality values. We develop models of measurement error for shotgun sequencing by combining the two perspectives above. We propose a logistic model taking quality scores as covariates. The model is trained by a procedure combining an EM algorithm and model selection techniques. The training results in calibration of quality values and leads to a more accurate construction of consensus. Besides Phred scores obtained from ABI sequencers, we apply the same technique to calibrate quality values that come along with Beckman sequencers.
Figures
Similar articles
-
The effect of sequence quality on sequence alignment.Bioinformatics. 2008 Apr 1;24(7):897-900. doi: 10.1093/bioinformatics/btn052. Epub 2008 Feb 23. Bioinformatics. 2008. PMID: 18296747
-
Effects of sample re-sequencing and trimming on the quality and size of assembled consensus sequences.Genet Mol Res. 2007 Oct 5;6(4):756-65. Genet Mol Res. 2007. PMID: 18058703
-
Optimal spliced alignments of short sequence reads.Bioinformatics. 2008 Aug 15;24(16):i174-80. doi: 10.1093/bioinformatics/btn300. Bioinformatics. 2008. PMID: 18689821
-
PhredEM: a phred-score-informed genotype-calling approach for next-generation sequencing studies.Genet Epidemiol. 2017 Jul;41(5):375-387. doi: 10.1002/gepi.22048. Epub 2017 May 31. Genet Epidemiol. 2017. PMID: 28560825 Free PMC article.
-
Large scale sequencing.Curr Protoc Bioinformatics. 2003 Aug;Chapter 11:Unit11.1. doi: 10.1002/0471250953.bi1101s02. Curr Protoc Bioinformatics. 2003. PMID: 18428694 Review.
Cited by
-
RIG: Recalibration and interrelation of genomic sequence data with the GATK.G3 (Bethesda). 2015 Feb 13;5(4):655-65. doi: 10.1534/g3.115.017012. G3 (Bethesda). 2015. PMID: 25681258 Free PMC article.
-
SEME: a fast mapper of Illumina sequencing reads with statistical evaluation.J Comput Biol. 2013 Nov;20(11):847-60. doi: 10.1089/cmb.2013.0111. J Comput Biol. 2013. PMID: 24195707 Free PMC article.
-
Next generation sequence analysis and computational genomics using graphical pipeline workflows.Genes (Basel). 2012 Aug 30;3(3):545-75. doi: 10.3390/genes3030545. Genes (Basel). 2012. PMID: 23139896 Free PMC article.
-
A framework for variation discovery and genotyping using next-generation DNA sequencing data.Nat Genet. 2011 May;43(5):491-8. doi: 10.1038/ng.806. Epub 2011 Apr 10. Nat Genet. 2011. PMID: 21478889 Free PMC article.
-
Assessing the necessity of confirmatory testing for exome-sequencing results in a clinical molecular diagnostic laboratory.Genet Med. 2014 Jul;16(7):510-5. doi: 10.1038/gim.2013.183. Epub 2014 Jan 9. Genet Med. 2014. PMID: 24406459 Free PMC article.
References
-
- Adams M.D., Fields,C. and Ventor,J.C. (eds). (1994) Automated DNA Sequencing and Analysis. Academic Press, London, San Diego.
-
- Ewing B. and Green,P. (1998) Base-calling of automated sequencer traces using phred. 2. Error probabilities. Genome Res., 8, 186–194. - PubMed
-
- Ewing B., Hillier,L., Wendl,M.C. and Green,P. (1998) Base-calling of automated sequencer traces using phred. 1. Accuracy assessment. Genome Res., 8, 175–185. - PubMed
-
- Churchill G.A. and Waterman,M.S. (1992) The accuracy of DNA sequences: estimating sequence quality. Genomics, 14, 89–98. - PubMed
-
- Parkhill J., Wren,B.W., Mungall,K., Ketley,J.M., Churcher,C., Basham,D., Chillingworth,T., Davies,R.M., Feltwell,T., Holroyd,S., et al. (2000) The genome sequence of the food-borne pathogen Campylobacter jejuni reveals hypervariable sequences. Nature, 403, 665–668. - PubMed
Publication types
MeSH terms
LinkOut - more resources
Full Text Sources
Other Literature Sources
