. 2004 Sep 29;24(39):8531-41.
doi: 10.1523/JNEUROSCI.1470-04.2004.

Akt-1 expression level regulates CNS precursors

Affiliations

Akt-1 expression level regulates CNS precursors

Amy D Sinor et al. J Neurosci. .

Abstract

Although most cells in the embryonic mouse cortex express the serine-threonine kinase Akt-1, a small population of progenitors expresses Akt-1 protein at a higher level. To determine the functional significance of this difference, we used a retrovirus to increase Akt-1 expression in cortical progenitors. Increased Akt expression enhanced Akt activation after growth factor stimulation of progenitors. In vivo, it promoted retention in progenitor layers, the ventricular zone and subventricular zone. In vitro, it enhanced proliferation and survival, but did not impair migration. Moreover, it increased the proportion of stem cells, defined by a self-renewal assay. These effects did not depend on the Akt substrate p21(Cip1). In contrast, rapamycin, an inhibitor of mTOR (mammalian target of rapamycin), altered effects of elevated Akt-1 selectively: it eliminated the increase in stem cells and reduced the proliferative response, but had no effect on survival. The ability of elevated Akt-1 to increase the self-renewing population therefore depends on a rapamycin-sensitive mechanism (presumably inhibition of mTOR activity) but not on p21(Cip1), and can be distinguished from its effects on the proliferation and survival of other types of progenitors. Our findings suggest that expression of a high level of Akt-1 by a subpopulation of cortical progenitors biases their responses to extrinsic signals to increase their survival, proliferation, and/or self-renewal. Heterogeneity in Akt-1 level among progenitors could therefore allow cells that share a microenvironment to respond differently to the same extrinsic signals.


Figures
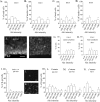
Figure 1.
Figure 1.
Heterogeneity in the level of Akt-Akt-1 expression among cortical cells. A small population of cells expressed a high level of Akt immunofluorescence at E13.5 (A) and E16.5 (C). The nestin+ progenitor population was enriched for Akthigh cells at E13.5 (B) and E16.5 (D). The cells were stained 1 hr after dissociation, using a pan-Akt antibody. At E13.5, cells from three embryos (40 cells per embryo) were counted. At E16.5, cells from three embryos (20 cells per embryo) were counted. *p = 0.01, comparing Akthigh cells among the nestin+ population to the total population (B vs A, D vs C). E, F, Sections of E16.5 cortex stained with pan-Akt (E) or Akt-1 specific (F) antibodies. The micrograph in E was obtained by conventional fluorescence microscopy, and the micrograph in F represents a stack of 4 × 1 μm images. G, H, The intensity of Akt-1 staining was quantified from confocal images, using measurements of fluorescence intensity in the apical (G) and basal (H) cytoplasm of cells within a 50-μm-wide, 100-μm-high region that included the ventricular surface and most of the ventricular zone. Eighty-one cells from three embryos were analyzed. A subpopulation of VZ cells expressed Akt-1 at a high level in both apical and basal cytoplasm. The size of the Akt-1high subpopulation was comparable to the Akthigh subpopulation (compare G, H to D). I-K, E13.5 cortical explants were infected with control virus, and the proportion of infected cells (β-gal+) that expressed Akt immunoreactivity at distinct fluorescence levels was determined 4 d later (I). Dissociated control-infected cells from an E13.5 explant stained with β-gal (J) and pan-Akt (K) antibodies. Primary (L) and secondary (M, N) neurosphere cultures were prepared from the explants, stained with β-gal and pan-Akt (L, M) antibodies, and analyzed as described above. Cells in N were stained with Akt-1 antibody, and fluorescence intensity was measured from confocal 1 μm images. Three culture preparations were used per condition, and 10-20 cells were counted per preparation. *p < 0.04 comparing control-infected cells from primary (L) or secondary (M, N) neurosphere colonies to E13.5 explants (H). Scale bars, 20 μm.
Figure 2.
Figure 2.
Elevating Akt-1 in vivo promoted retention in progenitor layers. E10.5 embryos were infected with either control or Akt-1 retroviruses. Six days later, the laminar distribution of control and Akt-1-infected cells was analyzed in the cortex (A), dentate gyrus (F), and olfactory bulb (G). In the cortex, more Akt-1-infected cells are seen in the VZ and SVZ (A, D, E) compared with control-infected cells (A-C). F, In the dentate gyrus, more Akt-1-infected cells remained in the primary proliferative region (N) compared with control-infected cells. G, In the olfactory bulb, more Akt-1-infected cells were seen in the SVZ compared with control-infected cells. B-E are micrographs of X-gal-stained cells in sections of E16.5 cortex infected with control (B, C) or Akt-1 (D, E) virus. C and E are higher-magnification images of cells shown in B and D, respectively. *p < 0.05. IZ, Intermediate zone; WM, white matter; CP (L), bottom half of cortical plate; CP (U) top half of cortical plate; MZ, marginal zone; N, primary proliferative layer; SP, secondary proliferative layer; P, dentate gyrus plate; ML, molecular layer, DF, differentiation field.
Figure 3.
Figure 3.
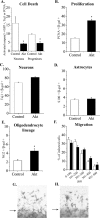
Elevating Akt-1 in vitro increased survival and proliferation without inducing large differences in cell fate or impairing migration. A, Progenitors in E13.5 cortical explants were infected with control or Akt-1 viruses. Four days later, cells were stained for activated caspase 3, a marker of dying cells, GFP (the viral marker) and TuJ1 (a neuron marker), or PCNA (a progenitor marker). Elevating Akt-1 reduced the proportion of activated caspase 3+ neurons and progenitors (A). Proliferation was also enhanced among the Akt-infected cells (B). Akt-1 infection did not alter the generation of neurons (C) or S-100β+ astrocytes (D). Elevating Akt-1 caused a small, but significant increase in NG2+ (oligodendrocyte lineage) cells (E). *p < 0.05. To determine whether elevating Akt-1 impaired migration, E13.5 explants were cultured in EGF plus FGF2 for 3 d to stimulate migration out of explants, as shown in G (control virus) and H (Akt virus). Arrows indicate edges of explants. The distance of infected cells from the edges of explants was measured and found to be comparable for Akt-infected and control-infected cells (F).
Figure 4.
Figure 4.
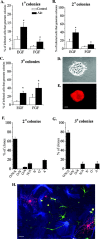
Elevating Akt-1 expression increased the proportion of multipotent stem cells. A-C, Akt-1-infected cells generated more colonies than control-infected cells after mitogen stimulation with either EGF (1 ng/ml) or FGF2 (10 ng/ml) in primary (A), secondary (B), and tertiary (C) cultures. E, A secondary neurosphere colony derived from an Akt-infected progenitor stained for β-gal; D shows a phase-contrast image of this colony. Note that most of the cells in this colony expressed the virally transduced gene. To induce differentiation, Akt-1-infected secondary or tertiary neurosphere colonies were grown on matrigel for 5 d without exogenous mitogens. The majority of secondary (F) and tertiary (G, H) neurosphere colonies derived from Akt-infected progenitors are able to generate the three major cell types (N/A/O), indicating derivation from a multipotent stem cell. For secondary colonies, 112 clones from three experiments were counted. For tertiary colonies, 100 clones from three experiments were counted. N, Neurons (TuJ1+ green cells in H); A, astrocytes (GFAP+ blue cells in H); O, oligodendrocytes (O4+ red cells in H). *p < 0.05. Scale bars, 20 μm.
Figure 5.
Figure 5.
Elevated Akt-1 expression enhanced Akt activation. E13.5 cortical progenitors were infected with control or Akt-1 viruses, cultured in EGF, as in Figure 4, and selected in G418 to obtain cultures enriched for infected cells. After 10 d, neurospheres were collected in serum-free, growth factor-free medium. Four hours later, half of the cells were stimulated with a mixture of EGF, FGF2, and insulin for 30-60 min. A, Representative Western blot, probed with antibodies to pAkt and actin. B, Summary of pAkt expression relative to actin, comparing control and Akt-infected cells in four sets of cultures. The mean difference in pAkt level (relative to actin) after stimulation was 10.2 ± 2.5 versus 74.4 ± 19.1, control-infected versus Akt-infected lysates (p = 0.03). C, Representative blot probed with Akt and actin antibodies. D, Summary of Akt expression (normalized to actin) comparing Akt-infected cells to control-infected cells in four sets of cultures. The mean difference in Akt expression (relative to actin) was 0.03 ± 0.004 versus 0.08 ± 0.004, control versus Akt (p = 0.0003).
Figure 6.
Figure 6.
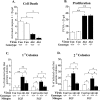
p21(Cip1) was not required for increased survival, proliferation, and stem cells induced by elevated Akt-1. Cortical explants from E13.5 wild-type (+/+) and p21(Cip1)-null (-/-) mice were infected with control or Akt-1 viruses, and the proportion of cells that expressed the cell death marker activated caspase 3 (A) or the proliferation marker PCNA (B) was counted 4 d later. Elevated Akt-1 still reduced death and increased proliferation in the absence of p21(Cip1). In the absence of p21(Cip1), fewer control-infected cells generated secondary neurospheres, suggesting that there are fewer CNS stem cells in the p21(Cip1)-null cortex. Even in the absence of p21(Cip1), however, elevating Akt-1 was still able to increase the proportion of cells that generate primary (C) and secondary (D) colonies approximately two fold when compared with control-infected cells, as in cultures from wild-type cortex. *p < 0.05; **p < 0.009.
Figure 7.
Figure 7.
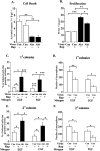
Rapamycin alters responses to elevated Akt-1 selectively. The mTOR inhibitor rapamycin (20 nm) was added to explants of E13.5 cortex infected with control or Akt virus. Methanol was added to control cultures. After 4 d, there was no difference in the proportion of caspase 3+ cells between methanol and rapamycin-treated cultures (A), indicating that elevating Akt-1 can still increase survival if mTOR is inhibited. Akt-1 elevation still increased proliferation if mTOR was inhibited, although the magnitude of this effect was reduced compared with cultures grown without rapamycin (B). Rapamycin treatment did not reduce proliferation in control-infected explants (B). Rapamycin was removed after 3 d of explant exposure, and the explants were used to generate primary (C, D) and secondary (E, F) neurosphere colonies. Note that rapamycin was not added to neurosphere cultures. Inhibiting mTOR transiently in explants caused a lasting reduction in stem cells among control- and Akt-infected (E) cells. Among the total population (D, F), which is derived primarily from uninfected cells, there is also a lasting reduction in EGF-responsive and FGF2-responsive stem cells. *p < 0.05; **p < 0.008; ***p < 0.0001.

Similar articles

Cited by

References

    1. Alessi DR, Andjelkovic M, Caudwell B, Cron P, Morrice N, Cohen P, Hemmings BA (1996a) Mechanism of activation of protein kinase B by insulin and IGF-1. EMBO J 15: 6541-6551. - PMC - PubMed
    1. Alessi DR, Caudwell FB, Andjelkovic M, Hemmings BA, Cohen P (1996b) Molecular basis for the substrate specificity of protein kinase B; comparison with MAPKAP kinase-1 and p70 S6 kinase. FEBS Lett 399: 333-338. - PubMed
    1. Arsenijevic Y, Weiss S, Schneider B, Aebischer P (2001) Insulin-like growth factor-I is necessary for neural stem cell proliferation and demonstrates distinct actions of epidermal growth factor and fibroblast growth factor-2. J Neurosci 21: 7194-7202. - PMC - PubMed
    1. Bottenstein JE, Sato GH (1979) Growth of a rat neuroblastoma cell line in serum-free supplemented medium. Proc Natl Acad Sci USA 76: 514-517. - PMC - PubMed
    1. Brazil DP, Hemmings BA (2001) Ten years of protein kinase B signalling: a hard Akt to follow. Trends Biochem Sci 26: 657-664. - PubMed

Publication types

MeSH terms