. 2004 Oct 13;23(20):4051-60.
doi: 10.1038/sj.emboj.7600385. Epub 2004 Sep 16.

MicroRNA genes are transcribed by RNA polymerase II

Affiliations

MicroRNA genes are transcribed by RNA polymerase II

Yoontae Lee et al. EMBO J. .

Abstract

MicroRNAs (miRNAs) constitute a large family of noncoding RNAs that function as guide molecules in diverse gene silencing pathways. Current efforts are focused on the regulatory function of miRNAs, while little is known about how these unusual genes themselves are regulated. Here we present the first direct evidence that miRNA genes are transcribed by RNA polymerase II (pol II). The primary miRNA transcripts (pri-miRNAs) contain cap structures as well as poly(A) tails, which are the unique properties of class II gene transcripts. The treatment of human cells with alpha-amanitin decreased the level of pri-miRNAs at a concentration that selectively inhibits pol II activity. Furthermore, chromatin immunoprecipitation analyses show that pol II is physically associated with a miRNA promoter. We also describe, for the first time, the detailed structure of a miRNA gene by determining the promoter and the terminator of mir-23a approximately 27a approximately 24-2. These data indicate that pol II is the main, if not the only, RNA polymerase for miRNA gene transcription. Our study offers a basis for understanding the structure and regulation of miRNA genes.


Figures
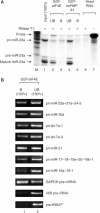
Figure 1
Figure 1
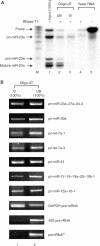
Pri-miRNAs contain the 5′ cap structures. (A) Affinity purification of cap-containing RNA followed by RPA. Total RNA from HeLa cells was used for selective enrichment using the cap-binding protein eIF4E. RNA was extracted from the bound (B) or unbound (UB) fraction. Because the whole RNA from each fraction was used for the assay without further normalization, it corresponds to 100% of the input. (B) RT–PCR demonstrating that cap is present not only in pri-miR-23a27a24-2 but also in pri-let-7a-1, pri-let-7a-3, pri-miR-30a, pri-miR-21, pri-miR-171819a2019b-1, and pri-miR-15a16-1. GAPDH pre-mRNA, 45S pre-rRNA, and pre-tRNAtyr were used as controls. The whole RNA extracted from each fraction (100% of the bound (B) or 100% of the unbound (UB) fraction) was used for the assay.
Figure 2
Figure 2
Pri-miRNAs are polyadenylated. (A) Selective enrichment of polyadenylated RNA from HeLa total RNA using oligo-dT cellulose, followed by RPA. RNA was extracted from the bound (B) or unbound (UB) fraction. Because the whole RNA from these fractions was used for the assay without further normalization, it corresponds to 100% of the input. (B) RT–PCR showing that poly(A) tail is present not only in pri-miR-23a27a24-2 but also in pri-let-7a-1, pri-let-7a-3, pri-miR-30a, pri-miR-21, pri-miR-171819a2019b-1, and pri-miR-15a16-1. GAPDH pre-mRNA, 45S pre-rRNA, and pre-tRNAtyr were used as controls. The whole RNA extracted from each fraction (100% of the bound (B) or 100% of the unbound (UB) fraction) was used for the assay.
Figure 3
Figure 3
Transcription of miRNA genes is sensitive to α-amanitin. HeLa cells were treated with α-amanitin at a concentration of either 0 or 50 μg/ml for 9 h. Total RNA was prepared from these cells and 5 μg of total RNA was subjected to cDNA synthesis in 20 μl reaction. The levels of pri-miRNAs were determined by RT–PCR using gene-specific primers. Different amounts (0.5, 1, or 2 μl) of cDNA template from the untreated cells (lanes 1–3) were used for PCR to see if the PCR amplification is in a quantitative range. GAPDH pre-mRNA, 45S pre-rRNA, and pre-tRNAtyr were used as controls.
Figure 4
Figure 4
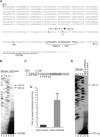
The 5′-terminal structure of the miRNA gene cluster miR-23a27a24-2. (A) Sequences around the transcription start site of miR-23a27a24-2 gene. The sequences that bind to the primer used for primer extension (PE23B) are indicated. The filled arrow indicates the major transcription start site as determined by primer extension, while the empty arrow shows the minor start site. (B) Primer extension analysis to determine the transcription initiation site. The extension product was detectable only after the cell was treated with siRNA against Drosha (+siDrosha, lane 5). (C) Schematic diagram of the reporter construct. The segment ranging from −603 to +36 bp relative to the transcription initiation site was placed at the upstream of the luciferase gene (pGL3-23P639). (D) Relative activities of the firefly luciferase are presented after normalization against the cotransfected Renilla luciferase activity (internal control). pGL3-basic is the promoter-less construct used as the backbone to generate pGL3-23P639. (E) Primer extension analysis. The transcription initiation site from the reporter construct (pGL3-23P639) is identical to that from the endogenous miR-23a27a24-2 gene. Note that the primer (PXT-luc) used for extension is complimentary to the luciferase mRNA.
Figure 5
Figure 5
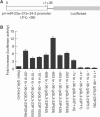
Analysis of the mir-23a∼27a∼24-2 gene promoter. (A) Schematic diagram of the reporter construct. The 5′ end (X) of the promoter varies from −2010 to +1, while the 3′ end corresponds to +36 relative to the transcription start site as determined in Figure 4. (B) Relative activities of luciferase expressed from the reporter constructs. The plasmids were cotransfected with Renilla luciferase construct into HEK293T cells and enzyme assay was carried out 48 h after transfection. Relative activities of the firefly luciferase are presented after normalization against the Renilla luciferase activity.
Figure 6
Figure 6
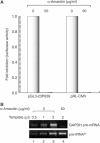
Transcription of mir-23a∼27a∼24-2 gene cluster is dependent on pol II. (A) Luciferase assay was performed using the reporter plasmid pGL3-23P639 or pRL-CMV. HEK293T cells were transfected with the reporter plasmids. Right after adding the plasmids, the cells were incubated in 0 or 50 μg/ml of α-amanitin for 6 h before the cells were harvested for assay. (B) RT–PCR to show that pol II activity (GAPDH pre-mRNA) is selectively reduced under this condition while pol III activity (pre-tRNAtyr) is not affected.
Figure 7
Figure 7
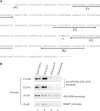
RNA pol II is physically associated with the promoter of mir-23a∼27a∼24-2 gene. (A) Sequences of the promoter region. The arrows indicate the primer sequences used for PCR. ‘+1' represents the major transcription start site. (B) ChIP analyses of HeLa cell cultures are shown. ChIP analyses were performed with monoclonal antibody (anti-pol II; 8WG16) against the C-terminal domain of the largest RNAP II subunit RPB1 or monoclonal antibody against the phosphorylated form of RPB1 (anti-pol II-P; H5). Normal mouse serum (preimmune) was also used as a negative control. Chromatin immunoprecipitates were analyzed by PCR with primer pairs flanking the promoter regions of miR-23a27a24-2, 45S rRNA promoter, or tRNAtyr gene. PCR products were resolved by agarose gel electrophoresis, revealed by staining with ethidium bromide, and presented as the reverse images.
Figure 8
Figure 8
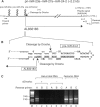
The 3′-terminal structure of the miRNA gene cluster mir-23a∼27a∼24-2. (A) Schematic representation of pri-miR-23a27a24-2. A putative polyadenylation signal (AAUAAA) was found at +1751 bp downstream from the 3′ end of mature miR-24-2. From database searches, we found an mRNA (AL832183) containing the sequences from right downstream of mature miR-24-2 (from +1 to +1771 relative to the 3′ end of miR-24-2). (B) AL832183 appears to be the by-product of Drosha-mediated processing because Drosha cleaves at the 3′ end of miR-24-2 and generates exactly the same 5′ end as that of AL832183. The cleavage sites generated by Drosha are indicated by arrows. (C) RT–PCR using three different reverse primers that bind to the sequences nearby the putative polyadenylation site as indicated in (A). The band of 2.2 kb was clearly detected when reverse primer A was used (lane 1). Note that this signal can be seen only when Drosha was depleted by transfecting siRNA against Drosha (siDrosha) (lanes 1–3). Genomic DNA was used as the template in lanes 7–9 to qualify the PCR primer pairs.

Similar articles

Cited by

References

    1. Ambros V, Bartel B, Bartel DP, Burge CB, Carrington JC, Chen X, Dreyfuss G, Eddy SR, Griffiths-Jones S, Marshall M, Matzke M, Ruvkun G, Tuschl T (2003) A uniform system for microRNA annotation. RNA 9: 277–279 - PMC - PubMed
    1. Aukerman MJ, Sakai H (2003) Regulation of flowering time and floral organ identity by a microRNA and its APETALA2-like target genes. Plant Cell 15: 2730–2741 - PMC - PubMed
    1. Baek SH, Ohgi KA, Rose DW, Koo EH, Glass CK, Rosenfeld MG (2002) Exchange of N-CoR corepressor and Tip60 coactivator complexes links gene expression by NF-kappaB and beta-amyloid precursor protein. Cell 110: 55–67 - PubMed
    1. Bartel DP (2004) MicroRNAs: genomics, biogenesis, mechanism, and function. Cell 116: 281–297 - PubMed
    1. Bernstein E, Caudy AA, Hammond SM, Hannon GJ (2001) Role for a bidentate ribonuclease in the initiation step of RNA interference. Nature 409: 363–366 - PubMed

Publication types

MeSH terms