

Nitric oxide-dependent mitochondrial biogenesis generates Ca2+ signaling profile of lupus T cells
- PMID: 15356113
- PMCID: PMC4034140
- DOI: 10.4049/jimmunol.173.6.3676
Nitric oxide-dependent mitochondrial biogenesis generates Ca2+ signaling profile of lupus T cells
Abstract
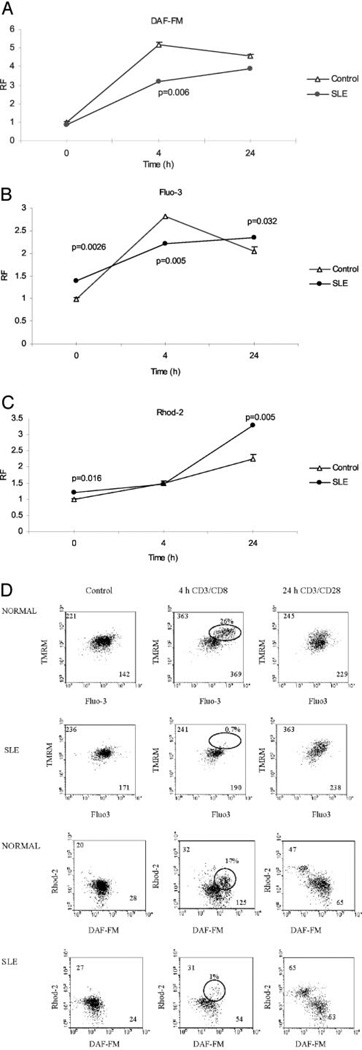
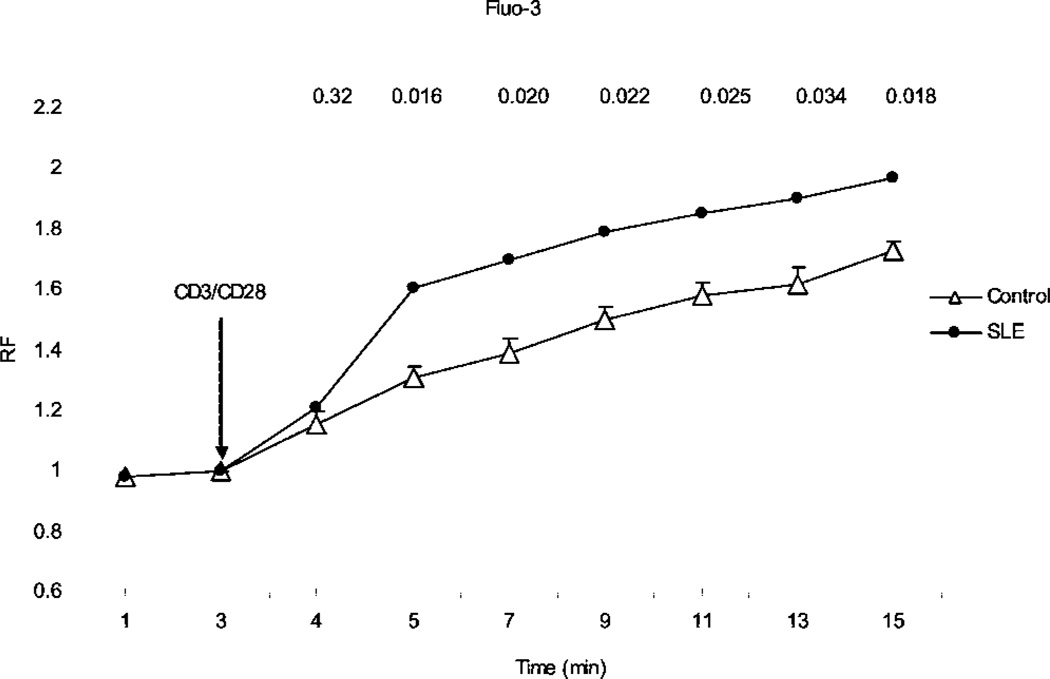
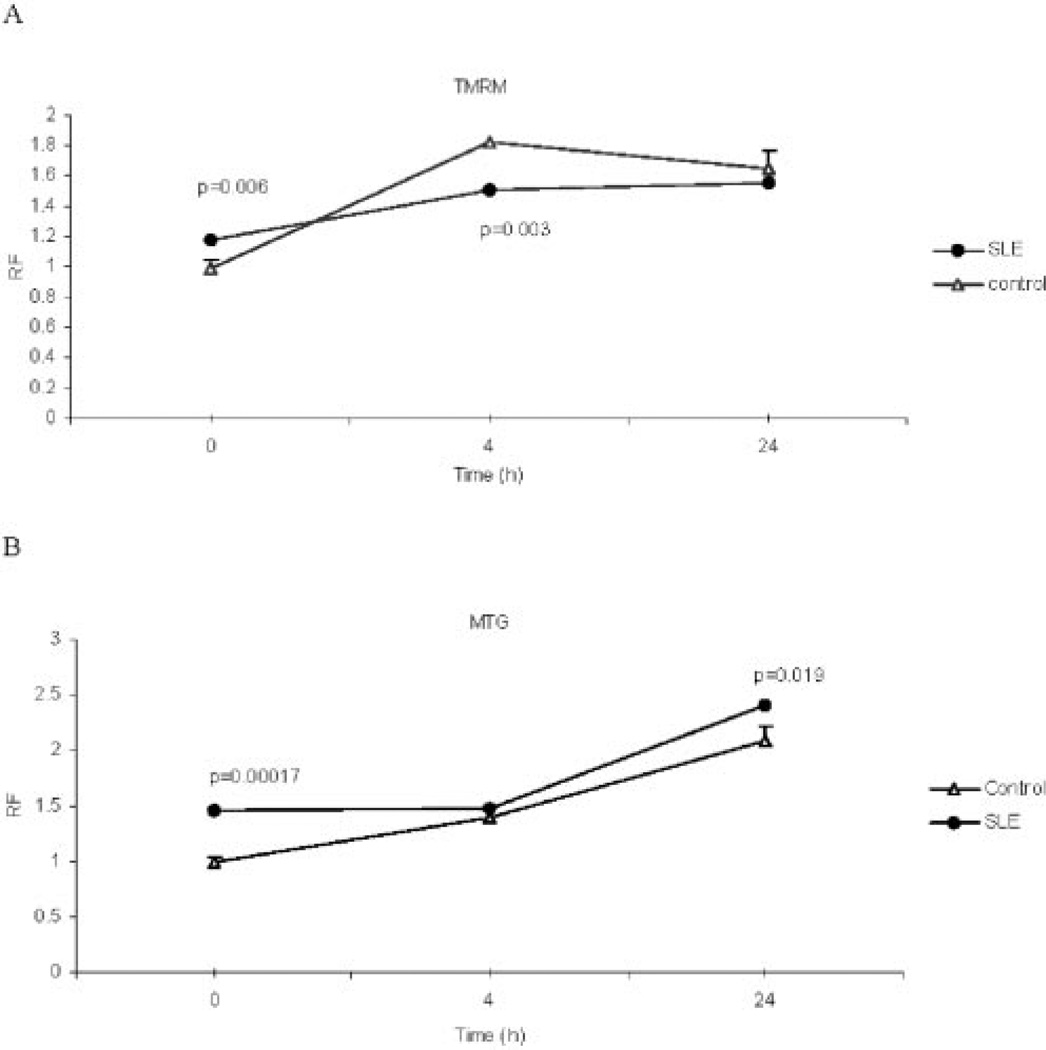
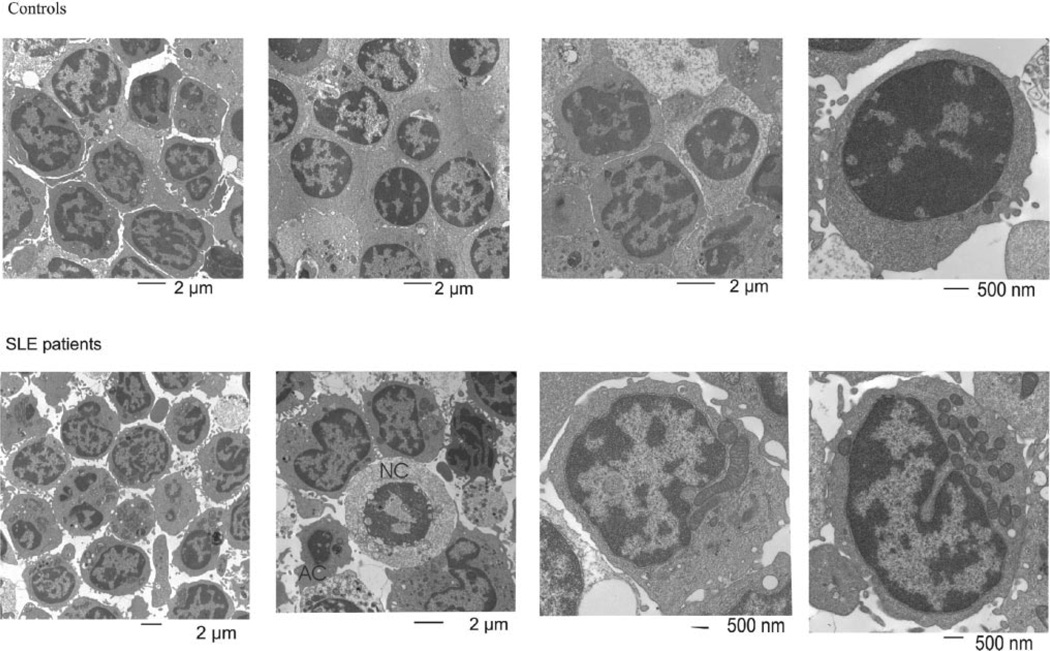
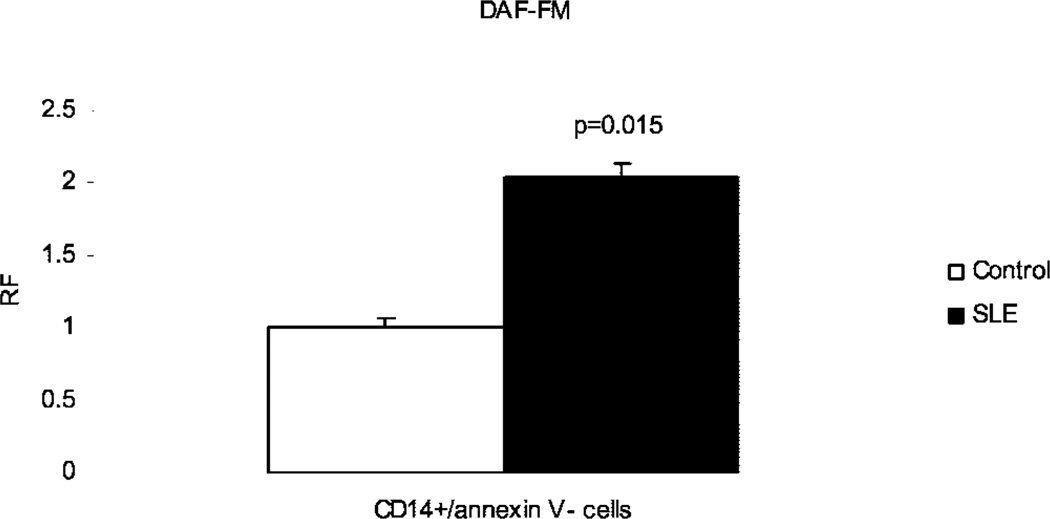
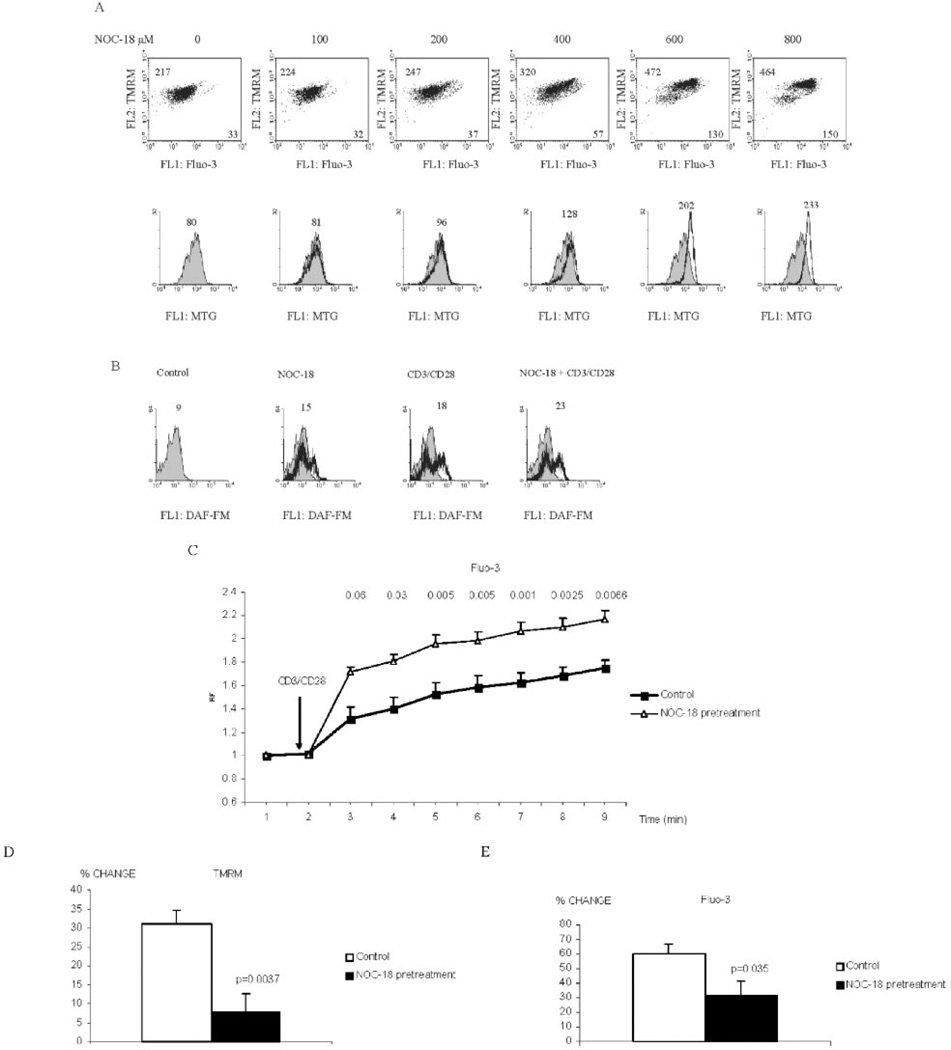
Abnormal T cell activation and cell death underlie the pathology of systemic lupus erythematosus. Although mitochondrial hyperpolarization (MHP) represents an early and reversible checkpoint of T cell activation and apoptosis, lupus T cells exhibit persistent MHP. NO has recently been recognized as a key signal of mitochondrial biogenesis and mediator of MHP in human T lymphocytes. In this study, we show that persistent MHP was associated with increased mitochondrial mass (+47.7 +/- 2.8%; p = 0.00017) and increased mitochondrial (+21.8 +/- 4.1%; p = 0.016) and cytoplasmic Ca2+ content in T cells from 19 systemic lupus erythematosus patients with respect to 11 control donors (+38.0 +/- 6.4%; p = 0.0023). Electron microscopy revealed that lupus lymphocytes contained 8.76 +/- 1.0 mitochondria, while control donors contained 3.18 +/- 0.28 mitochondria per cell (p = 0.0009). Increased mitochondrial mass in T cells was associated with 2.08 +/- 0.09-fold enhanced NO production by lupus monocytes (p = 0.0023). Activation of T cells through the TCR initiates a biphasic elevation in cytosolic free Ca2+ concentration, a rapid initial peak observed within minutes, and a plateau phase lasting up to 48 h. In response to CD3/CD28 costimulation, rapid Ca2+ fluxing was enhanced while the plateau phase was diminished in lupus T cells. NO-induced mitochondrial biogenesis in normal T cells enhanced the rapid phase and reduced the plateau of Ca2+ influx upon CD3/CD28 costimulation, thus mimicking the Ca2+ signaling profile of lupus T cells. Mitochondria constitute major Ca2+ stores and NO-dependent mitochondrial biogenesis may account for altered Ca2+ handling by lupus T cells.
Copyright 2004 The American Association of Immunologists, Inc.
Figures
Similar articles
-
T cell activation-induced mitochondrial hyperpolarization is mediated by Ca2+- and redox-dependent production of nitric oxide.J Immunol. 2003 Nov 15;171(10):5188-97. doi: 10.4049/jimmunol.171.10.5188. J Immunol. 2003. PMID: 14607919 Free PMC article.
-
Metabolic control of T cell activation and death in SLE.Autoimmun Rev. 2009 Jan;8(3):184-9. doi: 10.1016/j.autrev.2008.07.041. Epub 2008 Aug 21. Autoimmun Rev. 2009. PMID: 18722557 Free PMC article. Review.
-
Persistent mitochondrial hyperpolarization, increased reactive oxygen intermediate production, and cytoplasmic alkalinization characterize altered IL-10 signaling in patients with systemic lupus erythematosus.J Immunol. 2002 Jul 15;169(2):1092-101. doi: 10.4049/jimmunol.169.2.1092. J Immunol. 2002. PMID: 12097418 Free PMC article.
-
[Signal transduction abnormalities in systemic lupus erythematosus].Orv Hetil. 2005 Jul 31;146(31):1625-30. Orv Hetil. 2005. PMID: 16158611 Review. Hungarian.
-
Assessment of mitochondrial dysfunction in lymphocytes of patients with systemic lupus erythematosus.Methods Mol Biol. 2012;900:61-89. doi: 10.1007/978-1-60761-720-4_4. Methods Mol Biol. 2012. PMID: 22933065
Cited by
-
Distinct metabolic programs in activated T cells: opportunities for selective immunomodulation.Immunol Rev. 2012 Sep;249(1):104-15. doi: 10.1111/j.1600-065X.2012.01148.x. Immunol Rev. 2012. PMID: 22889218 Free PMC article. Review.
-
Central role of nitric oxide in the pathogenesis of rheumatoid arthritis and systemic lupus erythematosus.Arthritis Res Ther. 2010;12(3):210. doi: 10.1186/ar3045. Epub 2010 Jun 28. Arthritis Res Ther. 2010. PMID: 20609263 Free PMC article. Review.
-
Redox Pathogenesis in Rheumatic Diseases.ACR Open Rheumatol. 2024 Jun;6(6):334-346. doi: 10.1002/acr2.11668. Epub 2024 Apr 25. ACR Open Rheumatol. 2024. PMID: 38664977 Free PMC article. Review.
-
Estradiol differentially regulates calreticulin: a potential link with abnormal T cell function in systemic lupus erythematosus?Lupus. 2013 May;22(6):583-96. doi: 10.1177/0961203313482742. Epub 2013 Mar 27. Lupus. 2013. PMID: 23535532 Free PMC article.
-
The Mitochondrion-lysosome Axis in Adaptive and Innate Immunity: Effect of Lupus Regulator Peptide P140 on Mitochondria Autophagy and NETosis.Front Immunol. 2018 Sep 26;9:2158. doi: 10.3389/fimmu.2018.02158. eCollection 2018. Front Immunol. 2018. PMID: 30319621 Free PMC article.
References
-
- Kammer GM, Perl A, Richardson BC, Tsokos GC. Abnormal T cell Signal transduction in systemic lupus erythematosus. Arthritis Rheum. 2002;46:1139. - PubMed
-
- Elkon KB. Apoptosis in SLE—too little or too much? Clin. Exp. Rheumatol. 1994;12:553. - PubMed
-
- Perl A, Banki K. Molecular mimicry, altered apoptosis, and immunomodulation as mechanisms of viral pathogenesis in systemic lupus erythematosus. In: Kammer GM, Tsokos GC, editors. Lupus: Molecular and Cellular Pathogenesis. Totowa, NJ: Humana Press; 1999. pp. 43–64.
-
- Cohen JJ, Duke RC, Fadok VA, Sellins KS. Apoptosis and programmed cell death in immunity. Annu. Rev. Immunol. 1992;10:267. - PubMed
-
- Thompson CB. Apoptosis in the pathogenesis and treatment of disease. Science. 1995;267:1456. - PubMed
Publication types
MeSH terms
Substances
Grants and funding
LinkOut - more resources
Full Text Sources
Other Literature Sources
Medical
Miscellaneous