. 2004 Oct 5;101(40):14315-22.
doi: 10.1073/pnas.0405353101. Epub 2004 Sep 7.

Sfp1 is a stress- and nutrient-sensitive regulator of ribosomal protein gene expression

Affiliations

Sfp1 is a stress- and nutrient-sensitive regulator of ribosomal protein gene expression

Rosa M Marion et al. Proc Natl Acad Sci U S A. .

Abstract

Yeast cells modulate their protein synthesis capacity in response to physiological needs through the transcriptional control of ribosomal protein (RP) genes. Here we demonstrate that the transcription factor Sfp1, previously shown to play a role in the control of cell size, regulates RP gene expression in response to nutrients and stress. Under optimal growth conditions, Sfp1 is localized to the nucleus, bound to the promoters of RP genes, and helps promote RP gene expression. In response to inhibition of target of rapamycin (TOR) signaling, stress, or changes in nutrient availability, Sfp1 is released from RP gene promoters and leaves the nucleus, and RP gene transcription is down-regulated. Additionally, cells lacking Sfp1 fail to appropriately modulate RP gene expression in response to environmental cues. We conclude that Sfp1 integrates information from nutrient- and stress-responsive signaling pathways to help control RP gene expression.


Figures

Fig. 4.
Fig. 4.
Sfp1 is a direct regulator of RP genes and is required for appropriate down-regulation of RP gene expression in response to stress. (A) Microarray analysis comparing expression of RP genes in the following lanes: a, wild-type strain treated with rapamycin (Cy5 red) versus an untreated wild-type strain (Cy3 green) (1 h after addition of 100 nM rapamycin); b, sfp1Δ strain treated with rapamycin (Cy5 red) versus untreated sfp1Δ (Cy3 green) (1 h); c, sfp1Δ (Cy5 red) versus wild type (Cy3 green); d, sfp1Δ treated with rapamycin (Cy5 red) versus wild type treated with rapamycin (Cy3 green) (1 h). Data presented are the average of three independent microarray experiments. When examining the behavior of genes from various functional groups (47, 48) in the microarray experiments, RPs were the most significantly regulated functional group in lanes a, b, and c with P < 7.19 × 10-106, 1.13 × 10⁻²⁵, and 5.9 × 10-104, respectively. (B) Quantitative RT-PCR validation of microarray data. Expression levels of several RP mRNAs relative to ACT1 transcript levels were measured in wild-type and sfp1Δ strains, untreated or treated with 100 nM rapamycin (rap) for 1 h. (Upper) The fold repression of RP genes in response to rapamycin in both wild-type and sfp1Δ strains. (Lower) The comparison of RP gene expression in the sfp1Δ strain versus wild type, either under optimal growth conditions or after treatment with rapamycin. Values are the averages of three independent experiments; error bars show SEM. (C) Yeast cells lacking Sfp1 are defective in RP regulation in response to oxidative stress. Expression levels of several RP mRNAs relative to the ACT1 transcript were measured by quantitative RT-PCR in wild-type and sfp1Δ strains untreated or treated with 0.4 mM H2O2 for 60 min. (Upper) The fold repression of RP genes in response to H2O2 in both wild-type and sfp1Δ strains. (Lower) The comparison of RP gene expression in the sfp1Δ strain versus wild type, either under optimal growth conditions or after treatment with H2O2. Values are the averages of three independent experiments; error bars show SEM. (D) Chromatin immunoprecipitation analysis of Sfp1-HA3 in cells treated or untreated with 100 nM rapamycin. Sfp1 binding for the indicated promoter DNA relative to ACT1 DNA is represented by (immunoprecipitated DNA/input DNA)/(ACT1 immunoprecipitated DNA/ACT1 input DNA). Values are the averages of three independent experiments; error bars show standard deviations.
Fig. 1.
Fig. 1.
The TOR pathway controls Sfp1 subcellular localization. (A) Time course of Sfp1-GFP localization after TOR pathway inactivation. Cells were grown in synthetic dextrose medium, treated with 100 nM rapamycin, and analyzed by fluorescence microscopy. Images of the same live cells were captured every 4-5 min. (B) Rapamycin induces Sfp1 relocalization to the cytoplasm through inhibition of TOR signaling. Sfp1-GFP localization in rapamycin-resistant (TOR1-1) and wild-type strains untreated or treated with rapamycin (45 min after addition of 100 nM rapamycin).
Fig. 2.
Fig. 2.
Bioinformatics analysis reveals candidate Sfp1 target genes. (A) A significant fraction of potential Sfp1 target genes are coordinately repressed in stress and nutrient deprivation. (Left) A transcription factor-microarray matrix is shown, where red and green elements indicate a significant test for induction and repression of the candidate transcription factor target genes in a given microarray, respectively. The intensity of each entry corresponds to the -log10(P value) of the statistical test (black elements indicate a insignificant result). The matrix is the subcluster of the full analysis on 106 transcription factors and indicates the similar behavior of candidate target gene sets for Sfp1, Rap1, Abf1, Fhl1, and several additional factors. The matrix is filtered to show only microarrays with at least one significant test for the targets of those factors. (Right) The biological conditions associated with each microarray are shown as blue elements. Only annotations that were significant for candidate target gene sets of at least one factor in the Sfp1 cluster (P < 0.01, after a false discovery rate statistical correction for multiple hypotheses) are shown. Significant annotations for Sfp1 include response to stress (P < 1.24 × 10⁻⁸), amino acid (AA) starvation (P < 2.14 × 10⁻⁶), nitrogen depletion (P < 8.13 × 10⁻⁵), stationary phase (P < 4.17 × 10⁻⁸), and response to glucose starvation (P < 2.4 × 10⁻⁴). The targets of Sfp1 were also significantly repressed in many additional individual experiments, including treatment with hydrogen peroxide, DTT, MMS, and rapamycin. (B) RP genes underlie the coordinated expression pattern of Sfp1 targets. The matrix shows the expression pattern of all 63 potential Sfp1 target genes, highlighting (yellow) those targets identified by our methods to significantly (P < 10-25) underlie the coordinated changes identified in A. Among the 18 detected bona fide target genes, 14 encode RPs (red highlight). When iterating the analysis in A with this refined set of targets, the resulting profile is even more prominent (Sfp1 module column in A).
Fig. 3.
Fig. 3.
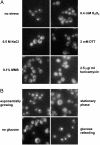
Cytosolic localization of Sfp1 correlates with conditions of RP gene down-regulation. (A) Sfp1-GFP localization under different stress conditions: 0.4 mM H2O2 (30 min after addition); 0.5 M NaCl (15 min after addition); 2 mM DTT (60 min after addition); 0.1% MMS (45 min after addition); 2.5 μg/ml tunicamycin (3.5 h after treatment). Images of the same field of cells were captured every 5 min after addition of the stress reagent; only one representative time point is shown. (B) Sfp1-GFP localization under different nutrient availability conditions: cells exponentially growing; cells grown to stationary phase; cells transferred to medium containing ethanol as a carbon source (10 min after transfer); and cells 10 min after refeeding of glucose (to cells in no glucose).
Fig. 5.
Fig. 5.
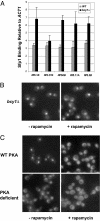
The TOR and PKA pathways control subcellular localization of Sfp1. (A) Chromatin immunoprecipitation analysis of Sfp1-HA3 in a strain containing constitutively active PKA (bcy1Δ) and in a wild-type strain. Sfp1 binding for the indicated promoter DNA relative to ACT1 DNA is represented by (immunoprecipitated DNA/input DNA)/(ACT1 immunoprecipitated DNA/ACT1 input DNA). Values are the averages of three independent experiments; error bars show standard deviations. (B) Sfp1-GFP localization in a bcy1Δ strain untreated or treated with rapamycin (45 min after addition of 100 nM rapamycin). (C) Sfp1-GFP localization in PKA-deficient (tpk1Δ tpk2Δ tpk3Δ msn2Δ msn4Δ) and PKA wild-type (msn2Δ msn4Δ) strains untreated or treated with rapamycin (45 min after addition of 100 nM rapamycin).
Fig. 6.
Fig. 6.
Model for regulation of Sfp1 by the PKA and TOR pathways (see text for details).

Similar articles

Cited by

References

    1. Saucedo, L. J. & Edgar, B. A. (2002) Curr. Opin. Genet. Dev. 12, 565-571. - PubMed
    1. Jacinto, E. & Hall, M. N. (2003) Nat. Rev. Mol. Cell. Biol. 4, 117-126. - PubMed
    1. Zhang, H., Stallock, J. P., Ng, J. C., Reinhard, C. & Neufeld, T. P. (2000) Genes Dev. 14, 2712-2724. - PMC - PubMed
    1. Oldham, S., Montagne, J., Radimerski, T., Thomas, G. & Hafen, E. (2000) Genes Dev. 14, 2689-2694. - PMC - PubMed
    1. Crespo, J. L. & Hall, M. N. (2002) Microbiol. Mol. Biol. Rev. 66, 579-591. - PMC - PubMed

Publication types

MeSH terms

Substances