

Dysregulation of gene expression in the 1-methyl-4-phenyl-1,2,3,6-tetrahydropyridine-lesioned mouse substantia nigra
- PMID: 15329391
- PMCID: PMC6729635
- DOI: 10.1523/JNEUROSCI.4204-03.2004
Dysregulation of gene expression in the 1-methyl-4-phenyl-1,2,3,6-tetrahydropyridine-lesioned mouse substantia nigra
Erratum in
- J Neurosci. 2004 Sep 22;24(38):1 p following 8244
Abstract
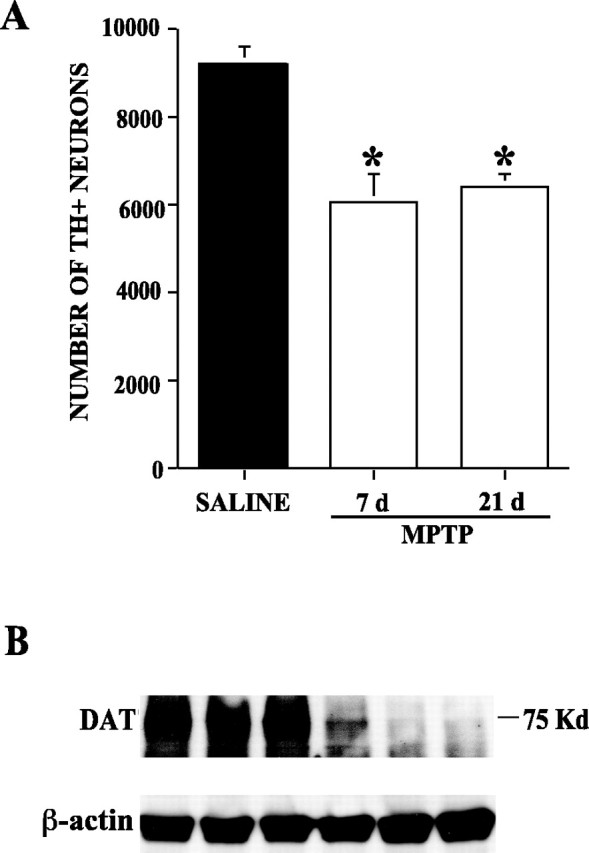
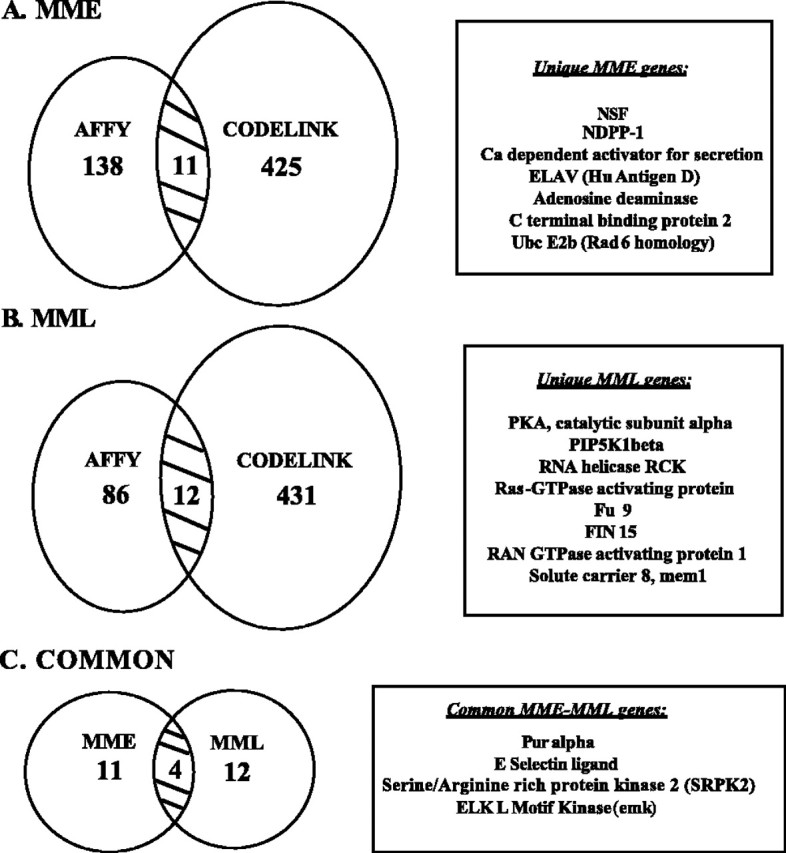
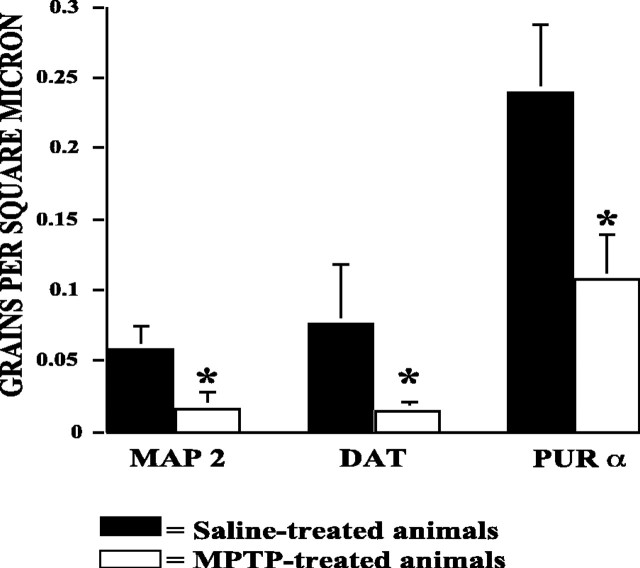
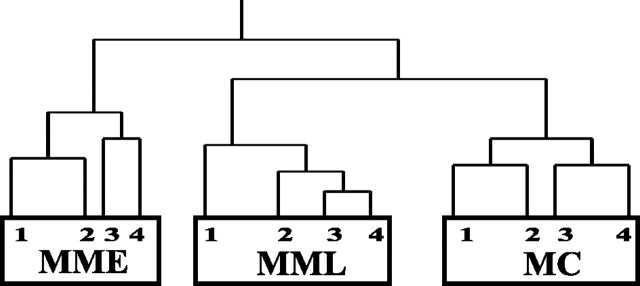
Parkinson's disease pathogenesis proceeds through several phases, culminating in the loss of dopaminergic neurons of the substantia nigra (SN). Although the 1-methyl-4-phenyl-1,2,3,6-tetrahydropyridine (MPTP) model of oxidative SN injury is frequently used to study degeneration of dopaminergic neurons in mice and non-human primates, an understanding of the temporal sequence of molecular events from inhibition of mitochondrial complex 1 to neuronal cell death is limited. Here, microarray analysis and integrative data mining were used to uncover pathways implicated in the progression of changes in dopaminergic neurons after MPTP administration. This approach enabled the identification of small, yet consistently significant, changes in gene expression within the SN of MPTP-treated animals. Such an analysis disclosed dysregulation of genes in three main areas related to neuronal function: cytoskeletal stability and maintenance, synaptic integrity, and cell cycle and apoptosis. The discovery and validation of these alterations provide molecular evidence for an evolving cascade of injury, dysfunction, and cell death.
Figures

Similar articles
-
Early signs of neuronal apoptosis in the substantia nigra pars compacta of the progressive neurodegenerative mouse 1-methyl-4-phenyl-1,2,3,6-tetrahydropyridine/probenecid model of Parkinson's disease.Neuroscience. 2006 Jun 19;140(1):67-76. doi: 10.1016/j.neuroscience.2006.02.007. Epub 2006 Mar 14. Neuroscience. 2006. PMID: 16533572
-
Decreased expression of serum- and glucocorticoid-inducible kinase 1 (SGK1) promotes alpha-synuclein increase related with down-regulation of dopaminergic cell in the Substantia Nigra of chronic MPTP-induced Parkinsonism mice and in SH-SY5Y cells.Gene. 2018 Jun 30;661:189-195. doi: 10.1016/j.gene.2018.03.086. Epub 2018 Mar 29. Gene. 2018. PMID: 29604467
-
[Parkinsonism induced by MPTP as an experimental model of Parkinson disease: similarities and differences].Neurologia. 1991 Oct;6(8):287-94. Neurologia. 1991. PMID: 1790005 Review. Spanish.
-
The mouse MPTP model: gene expression changes in dopaminergic neurons.Eur J Neurosci. 2003 Jan;17(1):1-12. doi: 10.1046/j.1460-9568.2003.02408.x. Eur J Neurosci. 2003. PMID: 12534964
-
[Experimental model of Parkinson disease: mechanisms and anatomo- pathological characteristics of MPTP neurotoxicity].Arch Neurobiol (Madr). 1992 Jul-Aug;55(4):175-82. Arch Neurobiol (Madr). 1992. PMID: 1417423 Review. Spanish.
Cited by
-
Selenotranscriptomic Analyses Identify Signature Selenoproteins in Brain Regions in a Mouse Model of Parkinson's Disease.PLoS One. 2016 Sep 22;11(9):e0163372. doi: 10.1371/journal.pone.0163372. eCollection 2016. PLoS One. 2016. PMID: 27656880 Free PMC article.
-
In vivo overexpression of synaptogyrin-3 promotes striatal synaptic dopamine uptake in LRRK2R1441G mutant mouse model of Parkinson's disease.Brain Behav. 2023 Feb;13(2):e2886. doi: 10.1002/brb3.2886. Epub 2023 Jan 9. Brain Behav. 2023. PMID: 36624932 Free PMC article.
-
Transcriptional signatures in Huntington's disease.Prog Neurobiol. 2007 Nov;83(4):228-48. doi: 10.1016/j.pneurobio.2007.03.004. Epub 2007 Apr 1. Prog Neurobiol. 2007. PMID: 17467140 Free PMC article. Review.
-
Transcriptional Regulation of the Synaptic Vesicle Protein Synaptogyrin-3 (SYNGR3) Gene: The Effects of NURR1 on Its Expression.Int J Mol Sci. 2022 Mar 26;23(7):3646. doi: 10.3390/ijms23073646. Int J Mol Sci. 2022. PMID: 35409005 Free PMC article.
-
Gene expression of proteins of the vesicle cycle in dopaminergic neurons in modeling of Parkinson's disease.Dokl Biochem Biophys. 2016 May;468(1):206-8. doi: 10.1134/S1607672916030133. Epub 2016 Jul 15. Dokl Biochem Biophys. 2016. PMID: 27417722
References
-
- Ali RR, Reichel MB, de Alwis M, Kanuga N, Kinnon C, Levinsky RJ, Hunt DM, Bhattacharya SS, Thrasher AJ (1998) Adeno-associated virus gene transfer to mouse retina. Hum Gene Ther 9: 81-86. - PubMed
-
- Beal F (2001) Experimental models of Parkinson's disease. Nat Rev Neurosci 2: 325-332. - PubMed
-
- Bezard E, Jaber M, Gonon F, Boireau A, Bloch B, Gross CE (2000) Adaptive changes in the nigrostriatal pathway in response to increased 1-methyl-4-phenyl-1,2,3,6-tetrahydropyridine-induced neurodegeneration in the mouse. Eur J Neurosci 12: 2892-2900. - PubMed
-
- Bohm H, Brinkmann V, Drab M, Henske A, Kurzchalia TV (1997) Mammaliam homologues of C. elegans PAR-1 are asymmetrically localized in epithelial cells and may influence their polarity. Curr Biol 7: 603-606. - PubMed
Publication types
MeSH terms
Substances
Grants and funding
LinkOut - more resources
Full Text Sources
Other Literature Sources
Molecular Biology Databases
