. 2004 Sep;24(17):7370-9.
doi: 10.1128/MCB.24.17.7370-7379.2004.

RNA-mediated programming of developmental genome rearrangements in Paramecium tetraurelia

Affiliations

RNA-mediated programming of developmental genome rearrangements in Paramecium tetraurelia

Olivier Garnier et al. Mol Cell Biol. 2004 Sep.

Abstract

The germ line genome of ciliates is extensively rearranged during development of the somatic macronucleus. Numerous sequences are eliminated, while others are amplified to a high ploidy level. In the Paramecium aurelia group of species, transformation of the maternal macronucleus with transgenes at high copy numbers can induce the deletion of homologous genes in sexual progeny, when a new macronucleus develops from the wild-type germ line. We show that this trans-nuclear effect correlates with homology-dependent silencing of maternal genes before autogamy and with the accumulation of approximately 22- to 23-nucleotide (nt) RNA molecules. The same effects are induced by feeding cells before meiosis with bacteria containing double-stranded RNA, suggesting that small interfering RNA-like molecules can target deletions. Furthermore, experimentally induced macronuclear deletions are spontaneously reproduced in subsequent sexual generations, and reintroduction of the missing gene into the variant macronucleus restores developmental amplification in sexual progeny. We discuss the possible roles of the approximately 22- to 23-nt RNAs in the targeting of deletions and the implications for the RNA-mediated genome-scanning process that is thought to determine developmentally regulated rearrangements in ciliates.


Figures

FIG. 1.
FIG. 1.
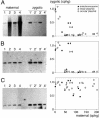
Induction of macronuclear deletions by maternal A29 transgenes. (A) Deletions of the zygotic A29 gene. A Southern blot of MfeI-restricted total DNA from representative clones transformed with the circular plasmid (maternal) and their postautogamous progeny (zygotic) was hybridized with the A29-specific probe a29 (see Materials and Methods), revealing a 5.6-kb fragment. Because the micronuclear/macronuclear ploidy ratio is ∼1:200 in vegetative cells, only macronuclear DNA is detectable. Lane 1, uninjected control. Lanes 2 to 4, clones transformed with various copy numbers of the circular A29 transgene; the smear arises from molecules linearized within the MfeI fragment after microinjection. Twice as much DNA was loaded onto the gel for postautogamous samples (lanes 1′ to 4′). In the graph on the right, A29 gene copy numbers in the zygotic macronucleus (zygotic) are plotted as a function of A29 gene copy numbers in the maternal macronucleus (maternal). Uninjected controls contained 1 cphg on average (maximum variation, 19%). Symbols used for the different forms of injected A29 transgenes are explained in the key. Solid arrowheads indicate the two clones that were expressing serotype A before autogamy. (B and C) Effects of maternal A29 transgenes on zygotic B and C genes, respectively. The same blot was rehybridized with the B-specific probe b or the C-specific probe c, revealing a 2.2- or 1.3-kb MfeI fragment, respectively. Graphs on the right show copy numbers of the B and C genes in the zygotic macronucleus.
FIG. 2.
FIG. 2.
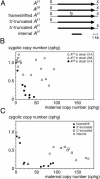
Effects of different maternal transgenes on A gene amplification in the zygotic macronucleus. (A) Map of the sequences present in the different constructs. S, SalI; X, XhoI; fs, frameshift. (B) Effects of A51 and A29 transgenes (as minichromosomes or circular plasmids) in strain 51A or 29A. Symbols used for each injection experiment are explained in the key. (C) Effects of A51 nonexpressible transgenes (as minichromosomes or circular plasmids) in strain 51A or 29A.
FIG. 3.
FIG. 3.
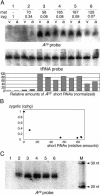
Northern blot detection of A29 short RNAs. (A) Analysis of total RNA samples from clones transformed with the circular A29 transgene. RNAs were extracted during vegetative growth (v) and autogamy (a) and were run on a 6% acrylamide sequencing gel. The blot was successively hybridized with the A29-specific probe a29 (top panel) and, as a loading control, with a 75-nt tRNA probe (bottom panel). Clone 1, uninjected control. For clones 2 to 6, copy numbers of the maternal A29 transgene (mat) and copy numbers of the endogenous A29 gene in the macronuclei of postautogamous progeny (zyg) (copies per haploid genome) are given. The histogram below shows the relative amount of A29 short RNAs in each sample, after normalization with the tRNA signal. (B) A gene copy numbers in the sexual progeny of transformed clones (zygotic) are plotted as a function of the relative amounts of A29 short RNAs in autogamous samples, as determined in panel A. (C) High-resolution analysis of autogamous samples. The same autogamous samples used for panel A were run on a 15% acrylamide gel and hybridized with the same probe. RNA molecular weight markers (M) were 32P labeled before electrophoresis.
FIG. 4.
FIG. 4.
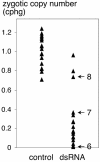
A gene deletions induced by dsRNA feeding. Copy numbers of the A51 gene were determined in individual postautogamous clones. Clones for which results are shown on the left (control) were derived from parental 51A cells that were fed the E. coli control strain prior to meiosis; clones for which results are shown on the right (dsRNA) were derived from parental 51A cells that were fed the dsRNA-producing E. coli strain. The reference value of 1 cphg was defined as the average copy number in control clones. A gene deletions in clones 6, 7, and 8 (arrows) are molecularly analyzed in Fig. 5C.
FIG. 5.
FIG. 5.
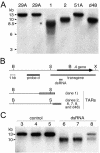
Mapping of induced and inherited A gene deletions. (A) Southern blot of BglII-restricted genomic DNA samples. The blot was hybridized with probe d (see map in panel B). The same 13-kb BglII-BglII fragment is obtained with wild-type strains 29A and 51A. The original d48 cell line shows a diffuse band migrating at ∼10 kb, which represents a BglII telomere fragment. Lane 1, first-generation macronuclear deletion obtained by transformation with A29; lane 2, stable 29AΔmac cell line derived from the clone for which results are shown in lane 1 by a few rounds of autogamy. (B) Map showing the deduced positions of the different TARs (striped boxes). The positions of probe d (solid rectangle) and the sequences covered by the injected transgene and by the E. coli dsRNA (shaded rectangles) are indicated. B, BglII; S, SalI; X, XhoI. (C) Mapping of dsRNA-induced A gene deletions. A Southern blot of BglII-restricted DNA was hybridized with probe d. Samples are individual clones from the postautogamous progeny of cells fed the control E. coli strain (lanes 3 to 5) or the dsRNA-producing strain (lanes 6 to 8) (see Fig. 4).
FIG. 6.
FIG. 6.
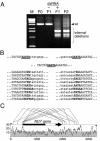
dsRNA-induced deletions of the ND7 gene. (A) PCR amplification of the ND7 gene in wild-type and mutant clones. The primers used (see panel C) produce a 3.2-kb fragment from the wild-type parental clone (F0). F1 lanes show products obtained from individual postautogamous clones derived from the F0 clone after feeding with Klebsiella (−) or with the dsRNA-producing E. coli strain (+). Lane F2 shows products obtained from an individual clone after a second autogamy of clone F1(+). (B) Sequences of the junctions of internal deletions in clone F1(+). Deletions occurred between short direct repeats (boldfaced), one of which is maintained in the rearranged sequence. Deleted sequences are lowercased. (C) Map of internal deletions. Thin bent lines above the map show the positions of deletion boundaries for each of the 10 sequenced examples. The tips of the solid arrowheads on both sides indicate the 3′ ends of PCR primers. The open rectangle within the ND7 coding sequence (solid arrow) indicates the sequence used for dsRNA production in E. coli. The plot below the map shows the local density of 5′-TA-3′ dinucleotides, computed in a 40-bp window sliding along the sequence (expressed as percent dinucleotides).
FIG. 7.
FIG. 7.
Trangene-induced reversion of inherited A gene macronuclear deletions. (A) Southern blot of HindIII-digested genomic DNA from representative transformed clones and controls (lanes 1 to 7) and their postautogamous progeny (lanes 1′ to 7′), hybridized with probe a29. Lane 1, 29A control clone; lane 2, 29AΔmac uninjected control clone; lanes 3 to 7, A29-transformed 29AΔmac clones. (B) Copy number of the A29 or A51 gene in the zygotic macronucleus as a function of the A29 or A51 transgene copy number in the maternal macronucleus. The only A51-transformed clone that did not express the A gene is indicated by a solid arrowhead. (C) Mapping of TARs in rescued and nonrescued clones. Shown is a Southern blot of BglII-digested genomic DNA, hybridized with probe d (see Fig. 5). Samples are the same as in panel A.

Similar articles

Cited by

References

    1. Caron, F., and E. Meyer. 1989. Molecular basis of surface antigen variation in paramecia. Annu. Rev. Microbiol. 43:23-42. - PubMed
    1. Cerutti, H. 2003. RNA interference: traveling in the cell and gaining functions? Trends Genet. 19:39-46. - PubMed
    1. Chalker, D. L., and M. C. Yao. 1996. Non-Mendelian, heritable blocks to DNA rearrangement are induced by loading the somatic nucleus of Tetrahymena thermophila with germ line-limited DNA. Mol. Cell. Biol. 16:3658-3667. - PMC - PubMed
    1. Chalker, D. L., and M. C. Yao. 2001. Nongenic, bidirectional transcription precedes and may promote developmental DNA deletion in Tetrahymena thermophila. Genes Dev. 15:1287-1298. - PMC - PubMed
    1. Chomczynski, P., and N. Sacchi. 1987. Single-step method of RNA isolation by acid guanidinium thiocyanate-phenol-chloroform extraction. Anal. Biochem. 162:156-159. - PubMed

Publication types