

Imaging of single-molecule translocation through nuclear pore complexes
- PMID: 15306682
- PMCID: PMC516490
- DOI: 10.1073/pnas.0403675101
Imaging of single-molecule translocation through nuclear pore complexes
Abstract
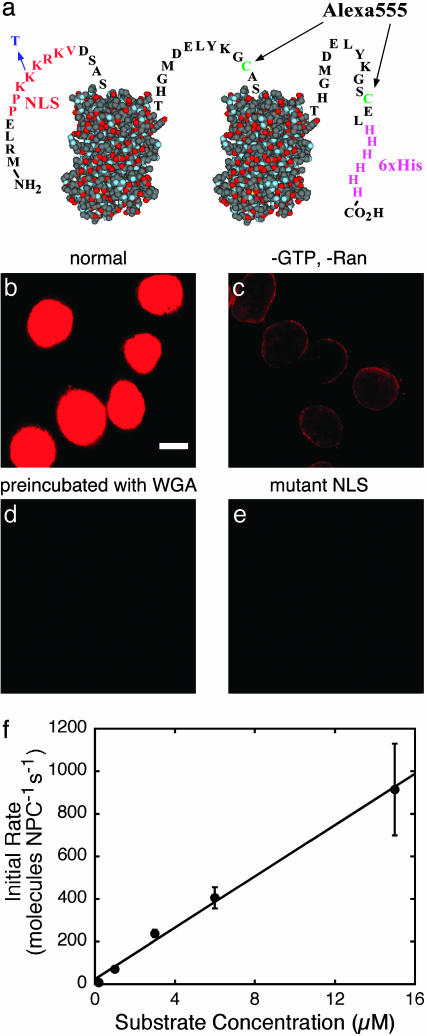
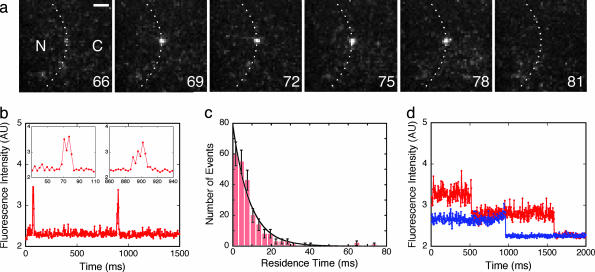
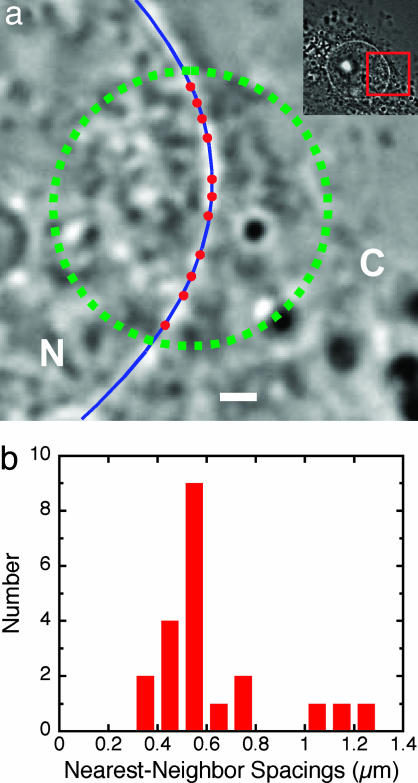
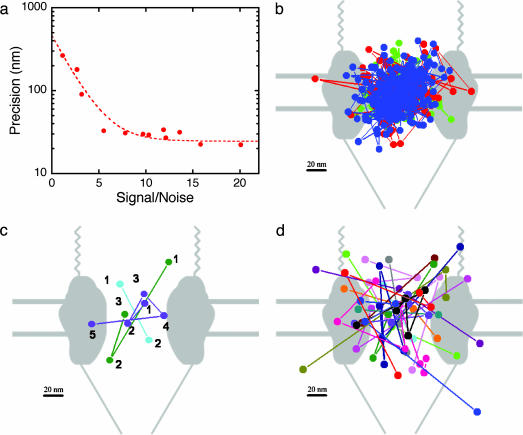
Nuclear pore complexes (NPCs) mediate bidirectional transport of proteins, RNAs, and ribonucleoprotein complexes across the double-membrane nuclear envelope. In vitro studies with purified transport cofactors have revealed a general scheme of cofactor-dependent transport energetically driven by the G protein Ran. However, the size and complexity of NPCs have made it difficult to clearly define the loci and kinetics of the cofactor-NPC interactions required for transport. We now report the use of single-molecule fluorescence microscopy to directly monitor a model protein substrate undergoing transport through NPCs in permeabilized cells. This substrate, NLS-2xGFP, interacts with NPCs for an average of 10 +/- 1 ms during transport. However, because the maximum nuclear accumulation rate of NLS-2xGFP was measured to be at least approximately 10(3) molecules per NPC per s, NPCs must be capable of transporting at least approximately 10 substrate molecules simultaneously. Molecular tracking reveals that substrate molecules spend most of their transit time randomly moving in the central pore of the NPC and that the rate-limiting step is escape from the central pore.
Copyright 2004 The National Academy of Sciencs of the USA
Figures
Similar articles
-
Visualizing single molecules interacting with nuclear pore complexes by narrow-field epifluorescence microscopy.Methods. 2006 Aug;39(4):316-28. doi: 10.1016/j.ymeth.2006.06.002. Methods. 2006. PMID: 16879979 Free PMC article.
-
Kinetic analysis of translocation through nuclear pore complexes.EMBO J. 2001 Mar 15;20(6):1320-30. doi: 10.1093/emboj/20.6.1320. EMBO J. 2001. PMID: 11250898 Free PMC article.
-
Autonomy and robustness of translocation through the nuclear pore complex: a single-molecule study.J Cell Biol. 2008 Oct 6;183(1):77-86. doi: 10.1083/jcb.200806173. Epub 2008 Sep 29. J Cell Biol. 2008. PMID: 18824568 Free PMC article.
-
Single-molecule studies of nucleocytoplasmic transport: from one dimension to three dimensions.Integr Biol (Camb). 2012 Jan;4(1):10-21. doi: 10.1039/c1ib00041a. Epub 2011 Oct 24. Integr Biol (Camb). 2012. PMID: 22020388 Free PMC article. Review.
-
Distinct, but not completely separate spatial transport routes in the nuclear pore complex.Nucleus. 2013 May-Jun;4(3):166-75. doi: 10.4161/nucl.24874. Epub 2013 May 1. Nucleus. 2013. PMID: 23669120 Free PMC article. Review.
Cited by
-
Imaging single molecules in living cells for systems biology.Mol Syst Biol. 2006;2:56. doi: 10.1038/msb4100100. Epub 2006 Oct 17. Mol Syst Biol. 2006. PMID: 17047663 Free PMC article. Review.
-
Barrier properties of Nup98 FG phases ruled by FG motif identity and inter-FG spacer length.Nat Commun. 2023 Feb 10;14(1):747. doi: 10.1038/s41467-023-36331-4. Nat Commun. 2023. PMID: 36765044 Free PMC article.
-
Single hepatitis-B virus core capsid binding to individual nuclear pore complexes in Hela cells.Biophys J. 2006 Oct 15;91(8):3123-30. doi: 10.1529/biophysj.106.087650. Epub 2006 Jul 28. Biophys J. 2006. PMID: 16877503 Free PMC article.
-
Single-molecule analysis of epidermal growth factor binding on the surface of living cells.EMBO J. 2006 Sep 20;25(18):4215-22. doi: 10.1038/sj.emboj.7601308. Epub 2006 Aug 31. EMBO J. 2006. PMID: 16946702 Free PMC article.
-
Investigating Subcellular Compartment Targeting Effect of Porous Coordination Cages for Enhancing Cancer Nanotherapy.Small. 2018 Nov;14(47):e1802709. doi: 10.1002/smll.201802709. Epub 2018 Sep 17. Small. 2018. PMID: 30222252 Free PMC article.
References
-
- Weis, K. (2003) Cell 112, 441–451. - PubMed
-
- Fahrenkrog, B. & Aebi, U. (2003) Nat. Rev. Mol. Cell Biol. 4, 757–766. - PubMed
-
- Rout, M. P. & Aitchison, J. D. (2001) J. Biol. Chem. 276, 16593–16596. - PubMed
-
- Stoffler, D., Feja, B., Fahrenkrog, B., Walz, J., Typke, D. & Aebi, U. (2003) J. Mol. Biol. 328, 119–130. - PubMed
Publication types
MeSH terms
Substances
Grants and funding
LinkOut - more resources
Full Text Sources
Other Literature Sources
Miscellaneous
