Evolutionarily conserved sequence elements that positively regulate IFN-gamma expression in T cells
- PMID: 15304658
- PMCID: PMC515107
- DOI: 10.1073/pnas.0400849101
Evolutionarily conserved sequence elements that positively regulate IFN-gamma expression in T cells
Abstract
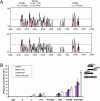
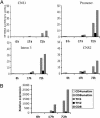
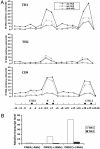
Our understanding of mechanisms by which the expression of IFN-gamma is regulated is limited. Herein, we identify two evolutionarily conserved noncoding sequence elements (IFNgCNS1 and IFNg CNS2) located approximately 5 kb upstream and approximately 18 kb downstream of the initiation codon of the murine Ifng gene. When linked to the murine Ifng gene (-3.4 to +5.6 kb) and transiently transfected into EL-4 cells, these elements clearly enhanced IFN-gamma expression in response to ionomycin and phorbol 12-myristate 13-acetate and weakly enhanced expression in response to T-bet. A DNase I hypersensitive site and extragenic transcripts at IFNgCNS2 correlated positively with the capacity of primary T cell subsets to produce IFN-gamma. Transcriptionally favorable histone modifications in the Ifng promoter, intronic regions, IFNgCNS2, and, although less pronounced, IFNgCNS1 increased as naïve T cells differentiated into IFN-gamma-producing effector CD8+ and T helper (TH) 1 T cells, but not into TH2 T cells. Like IFN-gamma expression, these histone modifications were T-bet-dependent in CD4+ cells, but not CD8+ T cells. These findings define two distal regulatory elements associated with T cell subset-specific IFN-gamma expression.
Figures


Similar articles
-
Eomesodermin promotes interferon-γ expression and binds to multiple conserved noncoding sequences across the Ifng locus in mouse thymoma cell lines.Genes Cells. 2016 Feb;21(2):146-62. doi: 10.1111/gtc.12328. Epub 2016 Jan 8. Genes Cells. 2016. PMID: 26749212
-
A distal conserved sequence element controls Ifng gene expression by T cells and NK cells.Immunity. 2006 Nov;25(5):717-29. doi: 10.1016/j.immuni.2006.09.007. Epub 2006 Oct 26. Immunity. 2006. PMID: 17070076
-
Regulation of the activity of IFN-gamma promoter elements during Th cell differentiation.J Immunol. 1998 Dec 1;161(11):6105-12. J Immunol. 1998. PMID: 9834094
-
Epigenetic control of interferon-gamma expression in CD8 T cells.J Immunol Res. 2015;2015:849573. doi: 10.1155/2015/849573. Epub 2015 Apr 20. J Immunol Res. 2015. PMID: 25973438 Free PMC article. Review.
-
Regulation of interferon-gamma during innate and adaptive immune responses.Adv Immunol. 2007;96:41-101. doi: 10.1016/S0065-2776(07)96002-2. Adv Immunol. 2007. PMID: 17981204 Review.
Cited by
-
Prenatal Dexamethasone and Postnatal High-Fat Diet Decrease Interferon Gamma Production through an Age-Dependent Histone Modification in Male Sprague-Dawley Rats.Int J Mol Sci. 2016 Sep 22;17(10):1610. doi: 10.3390/ijms17101610. Int J Mol Sci. 2016. PMID: 27669212 Free PMC article.
-
T-bet regulates Th1 responses through essential effects on GATA-3 function rather than on IFNG gene acetylation and transcription.J Exp Med. 2006 Mar 20;203(3):755-66. doi: 10.1084/jem.20052165. Epub 2006 Mar 6. J Exp Med. 2006. PMID: 16520391 Free PMC article.
-
Histone hyperacetylated domains across the Ifng gene region in natural killer cells and T cells.Proc Natl Acad Sci U S A. 2005 Nov 22;102(47):17095-100. doi: 10.1073/pnas.0502129102. Epub 2005 Nov 14. Proc Natl Acad Sci U S A. 2005. PMID: 16286661 Free PMC article.
-
Signal transduction pathways and transcriptional regulation in the control of Th17 differentiation.Semin Immunol. 2007 Dec;19(6):400-8. doi: 10.1016/j.smim.2007.10.015. Epub 2007 Dec 31. Semin Immunol. 2007. PMID: 18166487 Free PMC article. Review.
-
The transcription factors T-bet and Runx are required for the ontogeny of pathogenic interferon-γ-producing T helper 17 cells.Immunity. 2014 Mar 20;40(3):355-66. doi: 10.1016/j.immuni.2014.01.002. Epub 2014 Feb 13. Immunity. 2014. PMID: 24530058 Free PMC article.
References
-
- Szabo, S. J., Kim, S. T., Costa, G. L., Zhang, X., Fathman, G. C. & Glimcher, L. H. (2000) Cell 100, 655–669. - PubMed
-
- Avni, O., Lee, D., Macian, F., Szabo, S. J., Glimcher, L. H. & Rao, A. (2002) Nat. Immunol. 3, 643–651. - PubMed
-
- Fields, P. E., Kim, S. T. & Flavell, R. A. (2002) J. Immunol. 169, 647–650. - PubMed
-
- Szabo, S., Sullivan, B. M., Stemmann, C., Satoskar, A. R., Sleckman, B. P. & Glimcher, L. H. (2002) Science 295, 338–342. - PubMed
-
- Pearce, E. L., Mullen, A. C., Martins, G. A., Krawczyk, C. M., Hutchins, A. S., Zediak, V. P., Banica, M., DiCioccio, C. B., Gross, D. A., Mao, C., et al. (2003) Science 302, 1041–1043. - PubMed
Publication types
MeSH terms
Substances
Grants and funding
LinkOut - more resources
Full Text Sources
Research Materials

