

Visualization of antitumor treatment by means of fluorescence molecular tomography with an annexin V-Cy5.5 conjugate
- PMID: 15304657
- PMCID: PMC514472
- DOI: 10.1073/pnas.0401137101
Visualization of antitumor treatment by means of fluorescence molecular tomography with an annexin V-Cy5.5 conjugate
Abstract
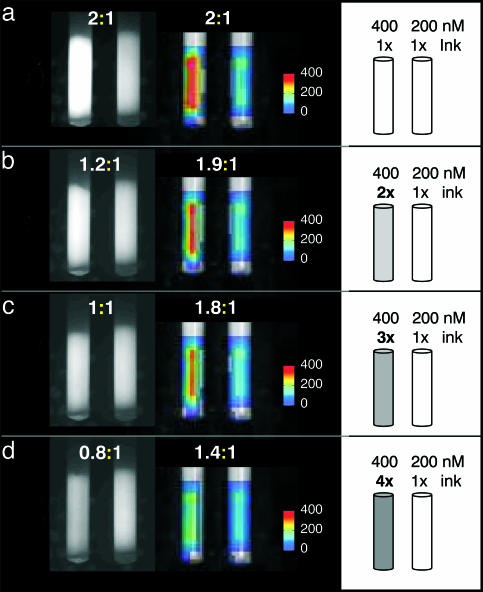
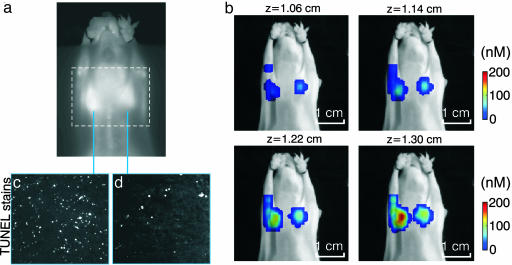
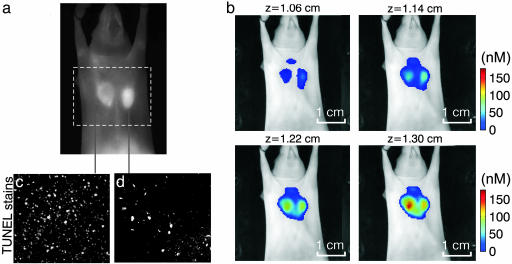
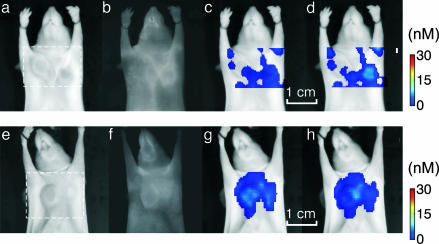
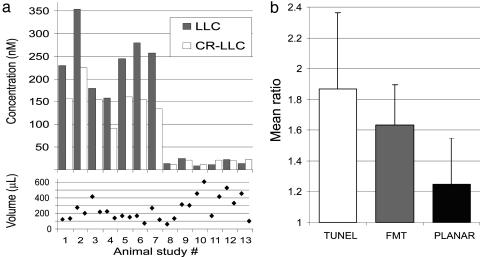
In vivo imaging of treatment responses at the molecular level could have a significant impact on the speed of drug discovery and ultimately lead to personalized medicine. Strong interest has been shown in developing quantitative fluorescence-based technologies with good molecular specificity and sensitivity for noninvasive 3D imaging through tissues and whole animals. We show herein that tumor response to chemotherapy can be accurately resolved by fluorescence molecular tomography (FMT) with a phosphatidylserine-sensing fluorescent probe based on modified annexins. We observed at least a 10-fold increase of fluorochrome concentration in cyclophosphamide-sensitive tumors and a 7-fold increase of resistant tumors compared with control studies. FMT is an optical imaging technique developed to overcome limitations of commonly used planar illumination methods and demonstrates higher quantification accuracy validated by histology. It is further shown that a 3-fold variation in background absorption heterogeneity may yield 100% errors in planar imaging but only 20% error in FMT, thus confirming tomographic imaging as a preferred tool for quantitative investigations of fluorescent probes in tissues. Tomographic approaches are found essential for small-animal optical imaging and are potentially well suited for clinical drug development and monitoring.
Figures
Similar articles
-
Quantitative analysis of chemotherapeutic effects in tumors using in vivo staining and correlative histology.Cell Oncol. 2005;27(3):183-90. doi: 10.1155/2005/791936. Cell Oncol. 2005. PMID: 16037639 Free PMC article.
-
Near-infrared fluorescent imaging of tumor apoptosis.Cancer Res. 2003 Apr 15;63(8):1936-42. Cancer Res. 2003. PMID: 12702586
-
Validation of in vivo fluorochrome concentrations measured using fluorescence molecular tomography.J Biomed Opt. 2005 Jul-Aug;10(4):44019. doi: 10.1117/1.1993427. J Biomed Opt. 2005. PMID: 16178652
-
Annexin A5-Gd-micelles-Cy5.5.2011 Feb 27 [updated 2011 Apr 27]. In: Molecular Imaging and Contrast Agent Database (MICAD) [Internet]. Bethesda (MD): National Center for Biotechnology Information (US); 2004–2013. 2011 Feb 27 [updated 2011 Apr 27]. In: Molecular Imaging and Contrast Agent Database (MICAD) [Internet]. Bethesda (MD): National Center for Biotechnology Information (US); 2004–2013. PMID: 21542558 Free Books & Documents. Review.
-
Fluorescence molecular imaging of small animal tumor models.Curr Mol Med. 2004 Jun;4(4):419-30. doi: 10.2174/1566524043360555. Curr Mol Med. 2004. PMID: 15354872 Review.
Cited by
-
High resolution tumor targeting in living mice by means of multispectral optoacoustic tomography.EJNMMI Res. 2012 Apr 1;2:14. doi: 10.1186/2191-219X-2-14. EJNMMI Res. 2012. PMID: 22464315 Free PMC article.
-
Multicolor fluorescence imaging of traumatic brain injury in a cryolesion mouse model.ACS Chem Neurosci. 2012 Jul 18;3(7):530-7. doi: 10.1021/cn3000197. Epub 2012 Apr 7. ACS Chem Neurosci. 2012. PMID: 22860222 Free PMC article.
-
Multifunctional Nanocarriers for diagnostics, drug delivery and targeted treatment across blood-brain barrier: perspectives on tracking and neuroimaging.Part Fibre Toxicol. 2010 Mar 3;7:3. doi: 10.1186/1743-8977-7-3. Part Fibre Toxicol. 2010. PMID: 20199661 Free PMC article. Review.
-
Advances in fluorescence imaging of the cardiovascular system.J Nucl Cardiol. 2008 May-Jun;15(3):417-28. doi: 10.1016/j.nuclcard.2008.03.001. J Nucl Cardiol. 2008. PMID: 18513648 Review. No abstract available.
-
All-optical anatomical co-registration for molecular imaging of small animals using dynamic contrast.Nat Photonics. 2007;1(9):526-530. doi: 10.1038/nphoton.2007.146. Nat Photonics. 2007. PMID: 18974848 Free PMC article.
References
-
- Herschman, H. R. (2003) Science 302, 605–608. - PubMed
-
- Massoud, T. F. & Gambhir, S. S. (2003) Genes Dev. 17, 545–580. - PubMed
-
- Blankenberg, F. G., Naumovski, L., Tait, J. F., Post, A. M. & Strauss, H. W. (2001) J. Nucl. Med. 42, 309–316. - PubMed
-
- Thompson, C. B. (1995) Science 267, 1456–1462. - PubMed
-
- Brooks, P. C., Montgomery, A. M., Rosenfeld, M., Reisfeld, R. A., Hu, T., Klier, G. & Cheresh, D. A. (1994) Cell 79, 1157–1164. - PubMed
Publication types
MeSH terms
Substances
Grants and funding
LinkOut - more resources
Full Text Sources
Other Literature Sources
