A role for heme in Alzheimer's disease: heme binds amyloid beta and has altered metabolism
- PMID: 15263070
- PMCID: PMC503755
- DOI: 10.1073/pnas.0404349101
A role for heme in Alzheimer's disease: heme binds amyloid beta and has altered metabolism
Abstract
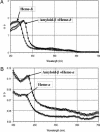
Heme is a common factor linking several metabolic perturbations in Alzheimer's disease (AD), including iron metabolism, mitochondrial complex IV, heme oxygenase, and bilirubin. Therefore, we determined whether heme metabolism was altered in temporal lobes obtained at autopsy from AD patients and age-matched nondemented subjects. AD brain demonstrated 2.5-fold more heme-b (P < 0.01) and 26% less heme-a (P = 0.16) compared with controls, resulting in a highly significant 2.9-fold decrease in heme-a/heme-b ratio (P < 0.001). Moreover, the strong Pearson correlation between heme-a and heme-b measured in control individuals (r(2) = 0.66, P < 0.002, n = 11) was abolished in AD subjects (r(2) = 0.076, P = 0.39, n = 12). The level of ferrochelatase (which makes heme-b in the mitochondrial matrix) in AD subjects was 4.2 times (P < 0.04) that in nondemented controls, suggesting up-regulated heme synthesis. To look for a possible connection between these observations and established mechanisms in AD pathology, we examined possible interactions between amyloid beta (A beta) and heme. A beta((1-40)) and A beta((1-42)) induced a redshift of 15-20 nm in the spectrum of heme-b and heme-a, suggesting that heme binds A beta, likely to one or more of the histidine residues. Lastly, in a tissue culture model, we found that clioquinol, a metal chelator in clinical trials for AD therapy, decreased intracellular heme. In light of these observations, we have proposed a model of AD pathobiology in which intracellular A beta complexes with free heme, thereby decreasing its bioavailability (e.g., heme-a) and resulting in functional heme deficiency. The model integrates disparate observations, including A beta, mitochondrial dysfunction, cholesterol, and the proposed efficacy of clioquinol.
Figures


Similar articles
-
Heme binding to Amyloid-beta peptide: mechanistic role in Alzheimer's disease.J Alzheimers Dis. 2006 Nov;10(2-3):255-66. doi: 10.3233/jad-2006-102-310. J Alzheimers Dis. 2006. PMID: 17119291 Review.
-
Amino acids variations in amyloid-beta peptides, mitochondrial dysfunction, and new therapies for Alzheimer's disease.J Bioenerg Biomembr. 2009 Oct;41(5):457-64. doi: 10.1007/s10863-009-9246-2. J Bioenerg Biomembr. 2009. PMID: 19806442 Review.
-
Heme, iron, and the mitochondrial decay of ageing.Ageing Res Rev. 2004 Jul;3(3):303-18. doi: 10.1016/j.arr.2004.02.002. Ageing Res Rev. 2004. PMID: 15231238 Review.
-
Amyloid-beta peptide binds with heme to form a peroxidase: relationship to the cytopathologies of Alzheimer's disease.Proc Natl Acad Sci U S A. 2006 Feb 28;103(9):3381-6. doi: 10.1073/pnas.0600134103. Epub 2006 Feb 21. Proc Natl Acad Sci U S A. 2006. PMID: 16492752 Free PMC article.
-
Interactions between amyloid-β and hemoglobin: implications for amyloid plaque formation in Alzheimer's disease.PLoS One. 2012;7(3):e33120. doi: 10.1371/journal.pone.0033120. Epub 2012 Mar 6. PLoS One. 2012. PMID: 22412990 Free PMC article.
Cited by
-
A delicate balance: Iron metabolism and diseases of the brain.Front Aging Neurosci. 2013 Jul 18;5:34. doi: 10.3389/fnagi.2013.00034. eCollection 2013. Front Aging Neurosci. 2013. PMID: 23874300 Free PMC article.
-
Microglia activated with the toll-like receptor 9 ligand CpG attenuate oligomeric amyloid {beta} neurotoxicity in in vitro and in vivo models of Alzheimer's disease.Am J Pathol. 2009 Nov;175(5):2121-32. doi: 10.2353/ajpath.2009.090418. Epub 2009 Oct 15. Am J Pathol. 2009. PMID: 19834064 Free PMC article.
-
Targeting Iron Dyshomeostasis for Treatment of Neurodegenerative Disorders.CNS Drugs. 2019 Nov;33(11):1073-1086. doi: 10.1007/s40263-019-00668-6. CNS Drugs. 2019. PMID: 31556017 Free PMC article. Review.
-
Mitochondrial Targeting in Neurodegeneration: A Heme Perspective.Pharmaceuticals (Basel). 2018 Sep 18;11(3):87. doi: 10.3390/ph11030087. Pharmaceuticals (Basel). 2018. PMID: 30231533 Free PMC article. Review.
-
From Synthesis to Utilization: The Ins and Outs of Mitochondrial Heme.Cells. 2020 Feb 29;9(3):579. doi: 10.3390/cells9030579. Cells. 2020. PMID: 32121449 Free PMC article. Review.
References
-
- Schipper, H. M., Cisse, S. & Stopa, E. G. (1995) Ann. Neurol. 37, 758–768. - PubMed
-
- Kimpara, T., Takeda, A., Yamaguchi, T., Arai, H., Okita, N., Takase, S., Sasaki, H. & Itoyama, Y. (2000) Neurobiol. Aging 21, 551–554. - PubMed
-
- Steffens, G. C., Biewald, R. & Buse, G. (1987) Eur. J. Biochem. 164, 295–300. - PubMed
-
- Maurer, I., Zierz, S. & Moller, H. J. (2000) Neurobiol. Aging 21, 455–462. - PubMed
Publication types
MeSH terms
Substances
LinkOut - more resources
Full Text Sources
Other Literature Sources
Medical

