

Glutamate transporter cluster formation in astrocytic processes regulates glutamate uptake activity
- PMID: 15254085
- PMCID: PMC6729534
- DOI: 10.1523/JNEUROSCI.1404-04.2004
Glutamate transporter cluster formation in astrocytic processes regulates glutamate uptake activity
Abstract
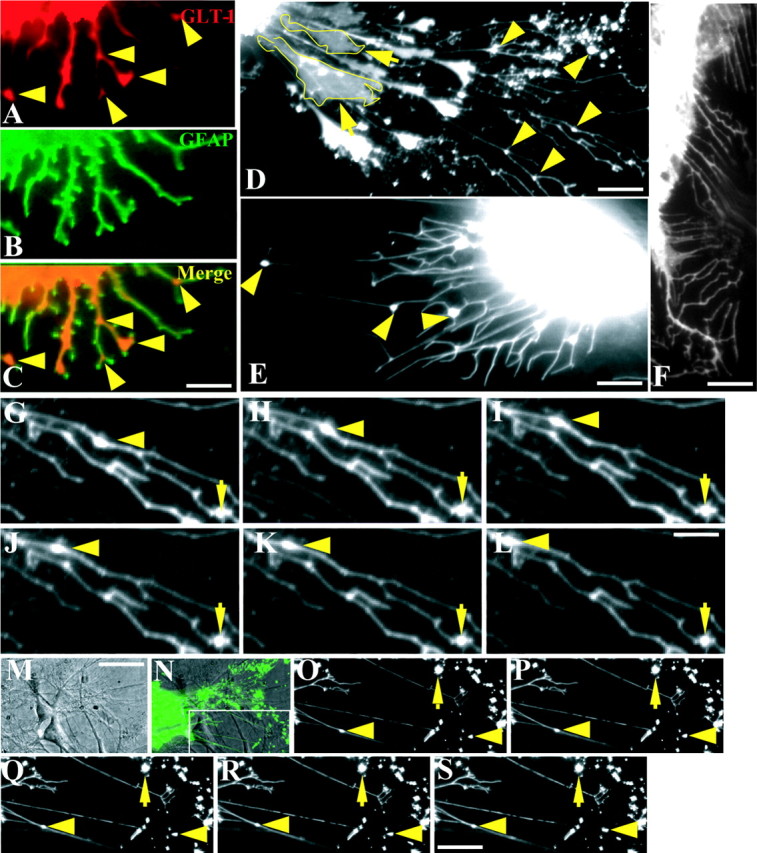
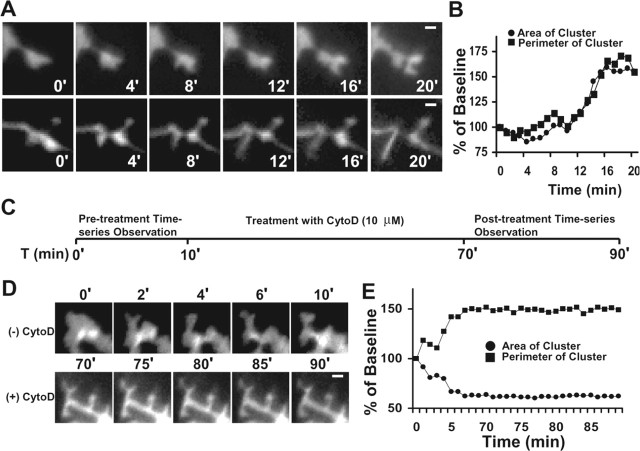
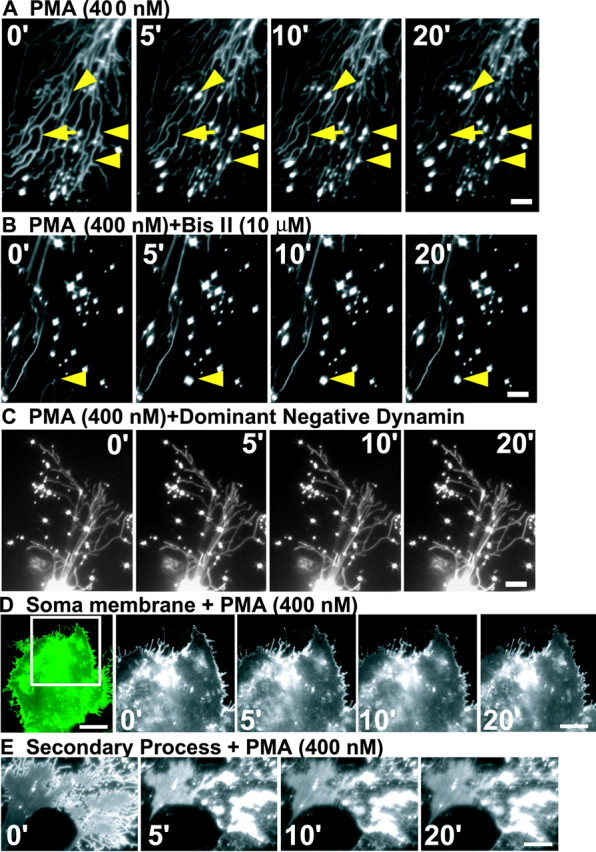
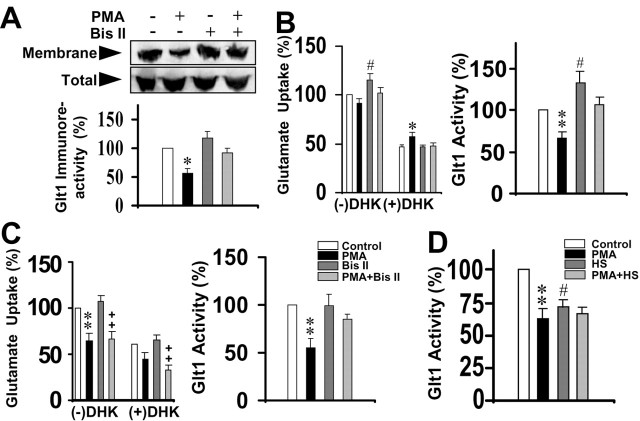
Glutamate is the predominant excitatory neurotransmitter in the CNS, and it is removed from the synaptic cleft by sodium-dependent glutamate transport activity. Glutamate transporter-1 (GLT-1) is expressed predominantly in astroglial cells and is responsible for the largest proportion of glutamate transport in the adult forebrain. In the present study, we demonstrate the ability of endogenous and recombinant GLT-1 to form clusters in astrocytic processes and characterize the mobility and physiological importance of these clusters in the regulation of GLT-1 activity in the presence or absence of neurons. At the distal end of C6 glioma cell processes, GLT-1 clusters undergo rapid morphological changes in both shape and size, and these changes are inhibited by cytochalasin D treatment, suggesting that the morphogenesis of GLT-1 clusters is highly dependent on the actin network. Treatment of astrocytes with phorbol 12-myristate 13-acetate (PMA) quickly and preferentially decreases GLT-1 localization on the process membrane, leading to de novo generation of GLT-1 clusters along the process shaft. Pretreatment with the PKC inhibitor bisindolylmaleimide II (Bis II), with sucrose (0.4 m), or through the expression of a dominant-negative form of dynamin prevents PMA-induced GLT-1 internalization and cluster formation. In terms of glutamate transporter function, PMA treatment elicits a significant decrease in GLT-1 activity that is prevented by preexposure to either Bis II or hypertonic treatment. Together, these data indicate that GLT-1 trafficking and cluster formation in glial cell processes are dynamic events that play important roles in regulating glutamate uptake in astrocytes and glioma cells.
Figures
Similar articles
-
Mechanisms of substrate transport-induced clustering of a glial glutamate transporter GLT-1 in astroglial-neuronal cultures.Eur J Neurosci. 2008 Nov;28(9):1719-30. doi: 10.1111/j.1460-9568.2008.06494.x. Eur J Neurosci. 2008. PMID: 18973588
-
Internalization and degradation of the glutamate transporter GLT-1 in response to phorbol ester.Neurochem Int. 2008 Mar-Apr;52(4-5):709-22. doi: 10.1016/j.neuint.2007.08.020. Epub 2007 Sep 6. Neurochem Int. 2008. PMID: 17919781 Free PMC article.
-
Conditional deletion of the glutamate transporter GLT-1 reveals that astrocytic GLT-1 protects against fatal epilepsy while neuronal GLT-1 contributes significantly to glutamate uptake into synaptosomes.J Neurosci. 2015 Apr 1;35(13):5187-201. doi: 10.1523/JNEUROSCI.4255-14.2015. J Neurosci. 2015. PMID: 25834045 Free PMC article.
-
GLT-1: The elusive presynaptic glutamate transporter.Neurochem Int. 2016 Sep;98:19-28. doi: 10.1016/j.neuint.2016.04.010. Epub 2016 Apr 26. Neurochem Int. 2016. PMID: 27129805 Free PMC article. Review.
-
Glutamate Transporter GLT-1 as a Therapeutic Target for Substance Use Disorders.CNS Neurol Disord Drug Targets. 2015;14(6):745-56. doi: 10.2174/1871527314666150529144655. CNS Neurol Disord Drug Targets. 2015. PMID: 26022265 Free PMC article. Review.
Cited by
-
Co-compartmentalization of the astroglial glutamate transporter, GLT-1, with glycolytic enzymes and mitochondria.J Neurosci. 2011 Dec 14;31(50):18275-88. doi: 10.1523/JNEUROSCI.3305-11.2011. J Neurosci. 2011. PMID: 22171032 Free PMC article.
-
Pathological phenotypes of astrocytes in Alzheimer's disease.Exp Mol Med. 2024 Feb;56(1):95-99. doi: 10.1038/s12276-023-01148-0. Epub 2024 Jan 4. Exp Mol Med. 2024. PMID: 38172603 Free PMC article. Review.
-
Ubiquitination-mediated internalization and degradation of the astroglial glutamate transporter, GLT-1.Neurochem Int. 2008 Dec;53(6-8):296-308. doi: 10.1016/j.neuint.2008.07.010. Epub 2008 Aug 29. Neurochem Int. 2008. PMID: 18805448 Free PMC article.
-
Activity-Dependent Plasticity of Astroglial Potassium and Glutamate Clearance.Neural Plast. 2015;2015:109106. doi: 10.1155/2015/109106. Epub 2015 Aug 4. Neural Plast. 2015. PMID: 26346563 Free PMC article. Review.
-
The stressed synapse: the impact of stress and glucocorticoids on glutamate transmission.Nat Rev Neurosci. 2011 Nov 30;13(1):22-37. doi: 10.1038/nrn3138. Nat Rev Neurosci. 2011. PMID: 22127301 Free PMC article. Review.
References
-
- Auger C, Attwell D (2000) Fast removal of synaptic glutamate by postsynaptic transporters. Neuron 28: 547-558. - PubMed
-
- Chaudhry FA, Lehre KP, van Lookeren Campagne M, Ottersen OP, Danbolt NC, Storm-Mathisen J (1995) Glutamate transporters in glial plasma membranes: highly differentiated localizations revealed by quantitative ultrastructural immunocytochemistry. Neuron 15: 711-720. - PubMed
-
- Conner SD, Schmid SL (2003) Regulated portals of entry into the cell. Nature 422: 37-44. - PubMed
-
- Conti F, Weinberg RJ (1999) Shaping excitation at glutamatergic synapses. Trends Neurosci 22: 451-458. - PubMed
Publication types
MeSH terms
Substances
Grants and funding
LinkOut - more resources
Full Text Sources
Medical
Miscellaneous
