. 2004 Jul;2(7):E207.
doi: 10.1371/journal.pbio.0020207. Epub 2004 Jul 13.

Lineage-specific gene duplication and loss in human and great ape evolution

Affiliations

Lineage-specific gene duplication and loss in human and great ape evolution

Andrew Fortna et al. PLoS Biol. 2004 Jul.

Abstract

Given that gene duplication is a major driving force of evolutionary change and the key mechanism underlying the emergence of new genes and biological processes, this study sought to use a novel genome-wide approach to identify genes that have undergone lineage-specific duplications or contractions among several hominoid lineages. Interspecies cDNA array-based comparative genomic hybridization was used to individually compare copy number variation for 39,711 cDNAs, representing 29,619 human genes, across five hominoid species, including human. We identified 1,005 genes, either as isolated genes or in clusters positionally biased toward rearrangement-prone genomic regions, that produced relative hybridization signals unique to one or more of the hominoid lineages. Measured as a function of the evolutionary age of each lineage, genes showing copy number expansions were most pronounced in human (134) and include a number of genes thought to be involved in the structure and function of the brain. This work represents, to our knowledge, the first genome-wide gene-based survey of gene duplication across hominoid species. The genes identified here likely represent a significant majority of the major gene copy number changes that have occurred over the past 15 million years of human and great ape evolution and are likely to underlie some of the key phenotypic characteristics that distinguish these species.


Conflict of interest statement

The authors have declared that no conflicts of interest exist.

Figures
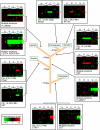
Figure 1
Figure 1. TreeView Images of Examples of Great Ape and HLS Gene Copy Number Increases and Decreases
Interhominoid cDNA aCGH was carried out as described in the text and Materials and Methods. Specific test DNAs were, left to right, human (H) (n = 5), bonobo (B) (n = 3), chimpanzee (C) (n = 4), gorilla (G) (n = 3), and orangutan (O) (n = 3). Each horizontal row represents aCGH data for one cDNA clone on the microarray, while each vertical column represents data from one microarray experiment. Regions shown contain LS genes (vertical black lines) and adjacent flanking genes ordered by chromosome map position using the UCSC Golden Path genome assembly (http://genome.ucsc.edu), November 2002 sequence freeze. Arrows denote for which hominoid lineage the copy number change is unique. Note that fluorescence ratios (pseudocolor scale indicated) reflect copy number changes relative to the human genome. For great ape LS changes, red signal is interpreted according to parsimony as increased gene copy number, and green signal as decreased gene copy number in the specific ape lineage, while increased or decreased gene copy number specific to the human lineage is represented by green or red signal, respectively, in all the great ape lineages. Gray signal indicates cDNA comparisons scored as absent. Estimates of the time at which indicated branch points occurred during hominoid evolution are derived from Chen and Li (2001).
Figure 2
Figure 2. Number of LS Genes for Indicated Hominoid Lineages
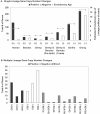
Totals of aCGH-identified LS genes are indicated for single lineages (A) and multiple (B) lineages, showing both increases (+) and decreases (–) for each. The numbers reflect totals after collapsing the dataset by UniGene cluster to remove redundant cDNAs corresponding to the same gene. Bonobo represents genes unique to this species; likewise with chimpanzee. “Bonobo and chimpanzee (pre-split)” refers to genes that were changed in both species and therefore likely occurred before these species diverged, and “bonobo and chimpanzee (total)” refers to the sum of the previous three categories, which was chosen to represent the period since the Homo/Pan split. Estimated evolutionary age of each lineage is also plotted for comparison. Letters denoting different great ape species are as in Figure 1. For (B), bonobo and chimpanzee were grouped together as one lineage (C), but selection criteria had to first be met by both species independently. In (B), no LS genes were identified for the following cases: C(+)G(–); CG(–)O(+); C(–)GO(+); and CO(+)G(–).
Figure 3
Figure 3. FISH Confirmation of a Human-Specific Duplication of a Gene Cluster on Chromosome 5q13.3 Detected by Interspecies cDNA aCGH
(A) Human duplication of a cluster of genes at Chromosome 5q13.3. is shown by two separate, and sometimes multiple, red BAC probe (CTD-2288G5) signals in interphase cells, with only one green BAC probe signal (RP11-1077O1) for a flanking region. Metaphase FISH shows both probes at band 5q13. The third nucleus in (A) shows four signals of the control probe (green) and eight copies of the BAC probe duplicated in the aCGH assay, consistent with the pattern expected in an S/G2 nucleus. (B–E) Bonobo (B), chimpanzee (C), gorilla (D), and orangutan (E) interphase FISH studies all show no increased signal for the human duplicated gene cluster, with signals of comparable size for the CTD-2288G5 (red) and the flanking RP11-107701 (green) probes. Metaphase FISH analyses show the gene cluster to be in the p arm of Chromosomes 4 (corresponding to the human Chromosome 5) in both the bonobo and chimpanzee, in the q arm of Chromosome 4 (corresponding to the human Chromosome 5) in the orangutan, and in the p arm of the gorilla Chromosome 19 (syntenic regions to human Chromosomes 5 and 17).
Figure 4
Figure 4. Independent Confirmation of Interspecies cDNA aCGH Data for Three Gene Families with Known Species Differences in Copy Number
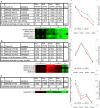
The chromosomal location, IMAGE clone ID, and GenBank accession are provided for each cDNA. The species average log2 ratios for each cDNA clone and the previously published estimate of gene copy number are shown for the indicated species. Also shown are TreeView images of interhominoid aCGH results for the indicated cDNAs, and a graphical depiction of the correlation between aCGH signal and published estimate of gene copy number (PECN). (A) FGF7 cDNA clone located on human Chromosome 15 was identified using the UCSC November 2002 human genome assembly and FGF7-like cDNA clones located on human Chromosome 9 were identified based on UniGene cluster sequence similarity to FGF7 reference sequence NM_002009. The correlation between published and aCGH-based copy number estimates is 0.97. (B) morpheus family cDNA clones were identified based on sequence similarity to one morpheus family member (Johnson et al. 2001). As in (A), except data relate to the morpheus genes and published data are from Johnson et al. (2001). Correlation = 0.97. (C) As in (A), except data relate to the CXYorf1 genes and published data are from Ciccodicola et al. (2000). Correlation = 0.99.
Figure 5
Figure 5. Whole Genome TreeView Representation of Interhominoid cDNA aCGH Data for Five Hominoid Species for Human Chromosomes 1–9
Hominoid species are identified by color bar (see key). Genes along each chromosome are ordered by map position. cDNAs mapping to multiple genome locations (more than 1 Mb apart) are shown at each of the multiple genomic locations. Fluorescence ratios are depicted using a pseudocolor scale (indicated). Megabase positions, cytobands, centromeres (black vertical triangles), and selected genes are indicated. Boxed and lettered regions (A–M) identify clusters of LS genes (greater than or equal to eight per cluster); insets show detailed views of clusters C, F, I, and M. The complete annotated interhomioid aCGH dataset depicted here is available in Table S1 and can be viewed either as a TreeView image (see Protocol S1) or as a tab-delimited text file that can be opened in Excel.
Figure 6
Figure 6. Whole Genome TreeView Representation of Interhominoid cDNA aCGH Data for Five Hominoid Species for Human Chromosomes 10–22, X, and Y
Data are as described for Figure 5, except boxed and lettered regions denoting clusters of LS genes are N–W. The complete annotated interhomioid aCGH dataset depicted here is available in Table S1 and can be viewed either as a TreeView image (see Protocol S1) or as a tab-delimited text file that can be opened in Excel.
Figure 7
Figure 7. TreeView Images of LS Genes for Different Hominoid Lineages and Lineage Combinations Ranked as a Function of aCGH Ratio
TreeView representation of cDNAs that exhibit great ape or human LS aCGH signatures are presented. Order of genes within each lineage is based on the average log2 fluorescence ratios (ordered highest to lowest) of the respective species. The dataset used for this figure was not collapsed by UniGene cluster to minimize the chance that significant LS cDNAs would be missed. Fluorescence ratios are depicted using a pseudocolor scale (indicated). The complete annotated LS dataset depicted here is available as Table S4 and can be viewed either as a TreeView image (see Protocol S1) or as a tab-delimited text file that can be opened in Microsoft Excel.

Similar articles

Cited by

References

    1. Bailey JA, Yavor AM, Massa HF, Trask BJ, Eichler EE. Segmental duplications: Organization and impact within the current human genome project assembly. Genome Res. 2001;11:1005–1017. - PMC - PubMed
    1. Bailey JA, Gu Z, Clark RA, Reinert K, Samonte RV, et al. Recent segmental duplications in the human genome. Science. 2002a;297:1003–1007. - PubMed
    1. Bailey JA, Yavor AM, Viggiano L, Misceo D, Horvath JE, et al. Human-specific duplication and mosaic transcripts: The recent paralogous structure of chromosome 22. Am J Hum Genet. 2002b;70:83–100. - PMC - PubMed
    1. Bieche I, Olivi M, Champeme MH, Vidaud D, Lidereau R, et al. Novel approach to quantitative polymerase chain reaction using real-time detection: Application to the detection of gene amplification in breast cancer. Int J Cancer. 1998;78:661–666. - PubMed
    1. Chen FC, Li WH. Genomic divergences between humans and other hominoids and the effective population size of the common ancestor of humans and chimpanzees. Am J Hum Genet. 2001;68:444–456. - PMC - PubMed

Publication types

MeSH terms

Associated data