. 2004 Jul 7;23(13):2651-63.
doi: 10.1038/sj.emboj.7600255. Epub 2004 Jun 24.

Human Orc2 localizes to centrosomes, centromeres and heterochromatin during chromosome inheritance

Affiliations

Human Orc2 localizes to centrosomes, centromeres and heterochromatin during chromosome inheritance

Supriya G Prasanth et al. EMBO J. .

Erratum in

  • EMBO J. 2005 Mar 9;24(5):1092-4

Abstract

The initiation of DNA replication in S phase requires the prior assembly of an origin recognition complex (ORC)-dependent pre-replicative complex on chromatin during G1 phase of the cell division cycle. In human cells, the Orc2 subunit localized to the nucleus as expected, but it also localized to centrosomes throughout the entire cell cycle. Furthermore, Orc2 was tightly bound to heterochromatin and heterochromatin protein 1alpha (HP1alpha) and HP1beta in G1 and early S phase, but during late S, G2 and M phases tight chromatin association was restricted to centromeres. Depletion of Orc2 by siRNA caused multiple phenotypes. A population of cells showed an S-phase defect with little proliferating cell nuclear antigen (PCNA) on chromatin, although MCM proteins remained. Orc2 depletion also disrupted HP1 localization, but not histone-H3-lysine-9 methylation at prominent heterochromatic foci. Another subset of Orc2-depleted cells containing replicated DNA arrested with abnormally condensed chromosomes, failed chromosome congression and multiple centrosomes. These results implicate Orc2 protein in chromosome duplication, chromosome structure and centrosome copy number control, suggesting that it coordinates all stages of the chromosome inheritance cycle.


Figures
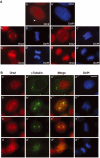
Figure 1
Figure 1
Orc2 localizes to the centrosomes. (A) Cell cycle distribution of Orc2. Cells were fixed with 1.0% paraformaldehyde and immunolabeling was carried out as described in Materials and methods. Indirect IF localization (red) of Orc2 proteins in HeLa cells during interphase (a), metaphase (b), early anaphase (c), late anaphase (d) and telophase (e). The arrow in (a) denotes the ‘dot' seen as the centrosome association during interphase. Chromatin was stained with 4′, 6-diaminidino-2-phenylindole (DAPI; a′–e′) in blue. Scale bar denotes 5 μm (a, a′) and 10 μm (b–e′). (B) Centrosome localization of Orc2. Dual-color indirect IF analysis using anti-Orc2 (red; a–d) together with γ-tubulin (green; a′–d′). Chromatin was stained with DAPI (blue; a‴–d‴). Merges highlight the areas of colocalization (yellow; a″–d″). The centrosome association of Orc2 was present during interphase, as single dot during G1 (A, a), as a doublet during S and G2 (B, a–a‴) and during subsequent mitotic stages, prometaphase (b–b‴), metaphase (c–c‴) and anaphase (d–d‴). Scale bar, 5 μm.
Figure 2
Figure 2
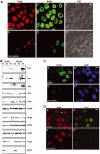
Heterochromatin association of Orc2. (A) IF following pre-extraction procedure was carried out to study colocalization of Orc2 (a) and HP1α (a′) in MCF7 cell line. Merge (a″) represents the areas of colocalization. The arrow in (a) and (a″) denotes the centrosome association of Orc2. (B) Orc2 immunoprecipitates HP1α and HP1β. Immunoprecipitation (IP; Nielsen et al, 1999) using Orc2 mAb and immunoblot with Orc2 pAb, HP1α, HP1β and HP1γ. Lane 1 represents input, lane 2 is 12CA5 mAb IP (mouse IgG negative control) and lane 3 is Orc2 IP. Note the light chain of IgG in HP1α, HP1β and HP1γ immunoblots (‘*' lanes 2 and 3). (C) Differential binding of Orc2 to heterochromatin. Dual-color immunolocalization studies in MCF7 cells of Orc2 (red; a–d) and PCNA (green; a′–d′) did not reveal significant colocalization (merges; a″–d″). (a–a′′) Early S, (b–b″, c–c″) mid-S and (d–d″) late S. (D) Orc2 decorates centromeres. Orc2 (a) and centromere marker AnaC (a′) show significant colocalization (a″) in MCF10A cells. DAPI (a‴) staining shows a typical late G2 cell. (E) Mouse Orc2 localizes to heterochromatin. Immunolocalization using Orc2 mAb in MEFS (a) shows Orc2 in DAPI dense pericentric heterochromatin blobs (a′). (F) Orc2 at centromeres is evolutionarily conserved. Orc2 (green) labeling in metaphase chromosome spreads from IMR-90 (a) and MEFs (b). (a′) and (b′) are higher magnification of individual chromosome from (a) and (b), respectively. Scale bars in (A), (C), (D) and (E) represent 5 μM.
Figure 3
Figure 3
Orc2 depletion has dual execution points. (A) Immunoblot of whole-cell extract from cells transfected with Orc2 siRNA duplex or control luciferase siRNA and harvested at different time points. Cells were transfected at 0, 24 and 48 h at about 20% starting confluence. Efficacy of RNAi was assessed by immunoblotting to detect Orc2. α-Tubulin levels were used as loading controls. Orc3 levels were also modulated and, with the reappearance of Orc2 in the cells at 144 h, the levels of Orc3 also increased. (B) Orc2 depletion at 72 h post siRNA shows morphologically two distinct populations of cells: the flat adherent cells and the rounded mitotic cells. (C) DNA content of control and Orc2 siRNA-treated cells at 48 h was determined by flow cytometry. Note a broader S phase and an increase in G2/M in Orc2 siRNA-treated cells. (D) Two-dimensional FACS to assess BrdU incorporation (10 min pulse) and DNA content by propidium iodide (PI) was assessed by flow cytometry in control and Orc2-depleted cells at 72 h. Note an increase in G2/M and accumulation of cells in S phase without incorporation of BrdU (see arrow) in Orc2-depleted cells. (E) Histogram showing the percentage of cells incorporating BrdU during a 24 h label at different time points after transfection, with Orc2 (gray bars) or luciferase control (white bars) siRNA duplexes. BrdU incorporation was allowed for 24 h to ensure that all cells had a chance to pass through at least one S phase.
Figure 4
Figure 4
Orc2 depletion affects S-phase progression. (A) Immunolabeling of cells at 72 h after transfection with control or Orc2 siRNA duplexes (a, b); BrdU incorporation during a 24 h pulse (a′, b′); Nomarski images (a″, b″). Scale bar, 10 μM. (B) Luciferase (control) and Orc2 siRNA duplex-treated cells were subjected to biochemical fractionation (Méndez and Stillman, 2000). The relative abundance of different replication proteins was tested by immunoblotting. S2, soluble cytosolic fraction; S3, soluble nuclear fraction; P3, chromatin-enriched fraction. Antibodies against Orc2, Orc1, Orc3, Orc6, Cdc6, MCM2, MCM3, MCM4, MCM7 and PCNA were used. Cytosolic kinase MEK2 was used as a control. Note that Orc3 and PCNA loading was affected in Orc2-depleted cells. (C) Chromatin association of PCNA was assessed by IF in control (a–a′) and Orc2-depleted cells (b–b′). DNA was stained with DAPI (a′, b′). Scale bar, 10 μM. (D) Chromatin-bound MCM3 was analyzed by a detergent pre-extraction procedure in control (a) and Orc2-depleted cells (b) by dual-color IF for MCM (red; a–b) and PCNA (green; a′–b′). The arrow in (a) denotes an MCM-positive, PCNA-negative G1 cell (Prasanth et al, 2004). Total number of cells positive for MCM2 and MCM3 in Orc2-depleted cells was 77 and 76%, respectively, whereas the same for the control was 62 and 60%. In control cells, the MCM2+/PCNA+ was 24%, MCM2+/PCNA− 38%, MCM2−/PCNA+ 2% and MCM2−/PCNA− 36%. Similar results were obtained for MCM3 in control cells. In contrast, for Orc2 siRNA-treated cells, MCM2+/PCNA+ was 15%, MCM2+/PCNA− 62% and MCM2−/PCNA− 23%. Scale bar, 10 μm. RNAi-treated cells were assessed at 72 h.
Figure 5
Figure 5
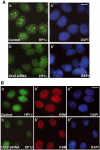
Orc2 depletion disrupts heterochromatin organization. (A) Prominent HP1α labeling in heterochromatin foci (a) in luciferase siRNA control cells as compared to loss of these foci in Orc2 siRNA-treated cells (72 h post transfection) (b). DNA was stained with DAPI (a′, b′). (B) Luciferase siRNA-treated cells showing HP1β-positive foci (a) at the sites of trimethyl K9 foci of histone H3 (a′); in contrast, in the Orc2 siRNA-treated cells, note the loss of HP1β foci (b) but no significant loss of trimethyl K9 foci (b′). Chromatin was stained with DAPI (blue; a″, b″). Scale bar in (A) and (B) represents 5 μM.
Figure 6
Figure 6
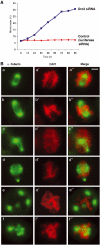
Orc2 depletion affects chromosome segregation and spindle organization. (A) Time course of mitotic index in control (luciferase siRNA treated, red) versus Orc2 siRNA-treated cells (blue) carried out by counting the α-tubulin-staining cells with mitotic asters. (B) IF with α-tubulin (green) and DAPI (red) was used to study the spindle structure and chromosome alignment in mitotically arrested cells depleted of Orc2 at 72 h post transfection. Chromosome congression failure with unaligned chromosomes (a–a″, b–b″, c–c″, d–d″, e–e″, f–f″), and spindle defects with asymmetric, bipolar (c–c″) and multipolar spindles (d–d″, e–e″, f–f″) were observed. More than 55% of mitotic cells showed lagging chromosomes, as compared to 11% in control. Merges are shown in (a″), (b″), (c″), (d″), (e″) and (f″). Scale bar, 5 μM.
Figure 7
Figure 7
Immunolocalization of CENP-F following Orc2 siRNA. CENP-F in control and Orc2 siRNA-treated cells was determined by IF. Control siRNA showed kinetochore and centrosome staining (a–a′). Cells lacking Orc2 showed increased CENP-F staining at unaligned kinetochores but lacked centrosome staining (b–b′, c–c′). DNA was stained with DAPI (blue). Scale bar, 5 μM.
Figure 8
Figure 8
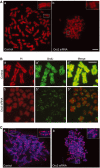
Orc2 depletion causes chromosome condensation defects. (A) Metaphase plate preparation in control (a) and in Orc2-depleted (b) cells (72 h). Insets in (a) and (b) are higher magnification of the boxed portion of the image. Scale bar, 10 μM. (B) Cells were labeled with BrdU for 24 h (from 72 to 96 h) and mitotic chromosomes spread as in (A). Control metaphase chromosomes (a–a″) and Orc2-1-depleted cells (b–b″). Red, PI staining (a, b); green, BrdU labeling (a′, b′); merge (a″–b″). Scale bar, 5 μM. (C) Status of a non-SMC subunit of condensin I (h-CAP-G, red) in metaphase chromosomes of control (a) and Orc2 depleted (b). Insets in (a) and (b) are higher magnification of the boxed portion of the image. DNA was stained with DAPI (blue).

Similar articles

Cited by

References

    1. Allshire RC (1995) Elements of chromosome structure and function in fission yeast. Semin Cell Biol 6: 55–64 - PubMed
    1. Andersen JS, Wilkinson CJ, Mayor T, Mortensen P, Nigg EA, Mann M (2003) Proteomic characterization of the human centrosome by protein correlation profiling. Nature 426: 570–574 - PubMed
    1. Aparicio OM, Weinstein DM, Bell SP (1997) Components and dynamics of DNA replication complexes in S. cerevisiae: redistribution of MCM proteins and Cdc45p during S phase. Cell 91: 59–69 - PubMed
    1. Bannister AJ, Zegerman P, Partridge JF, Miska EA, Thomas JO, Allshire RC, Kouzarides T (2001) Selective recognition of methylated lysine 9 on histone H3 by the HP1 chromo domain. Nature 410: 120–124 - PubMed
    1. Bell SP, Dutta A (2002) DNA replication in eukaryotic cells. Annu Rev Biochem 71: 333–374 - PubMed

Publication types

MeSH terms

LinkOut - more resources