. 2004 Aug;15(8):3642-57.
doi: 10.1091/mbc.e03-11-0796. Epub 2004 May 14.

Mitosis-specific anchoring of gamma tubulin complexes by pericentrin controls spindle organization and mitotic entry

Affiliations

Mitosis-specific anchoring of gamma tubulin complexes by pericentrin controls spindle organization and mitotic entry

Wendy C Zimmerman et al. Mol Biol Cell. 2004 Aug.

Abstract

Microtubule nucleation is the best known function of centrosomes. Centrosomal microtubule nucleation is mediated primarily by gamma tubulin ring complexes (gamma TuRCs). However, little is known about the molecules that anchor these complexes to centrosomes. In this study, we show that the centrosomal coiled-coil protein pericentrin anchors gamma TuRCs at spindle poles through an interaction with gamma tubulin complex proteins 2 and 3 (GCP2/3). Pericentrin silencing by small interfering RNAs in somatic cells disrupted gamma tubulin localization and spindle organization in mitosis but had no effect on gamma tubulin localization or microtubule organization in interphase cells. Similarly, overexpression of the GCP2/3 binding domain of pericentrin disrupted the endogenous pericentrin-gamma TuRC interaction and perturbed astral microtubules and spindle bipolarity. When added to Xenopus mitotic extracts, this domain uncoupled gamma TuRCs from centrosomes, inhibited microtubule aster assembly, and induced rapid disassembly of preassembled asters. All phenotypes were significantly reduced in a pericentrin mutant with diminished GCP2/3 binding and were specific for mitotic centrosomal asters as we observed little effect on interphase asters or on asters assembled by the Ran-mediated centrosome-independent pathway. Additionally, pericentrin silencing or overexpression induced G2/antephase arrest followed by apoptosis in many but not all cell types. We conclude that pericentrin anchoring of gamma tubulin complexes at centrosomes in mitotic cells is required for proper spindle organization and that loss of this anchoring mechanism elicits a checkpoint response that prevents mitotic entry and triggers apoptotic cell death.


Figures
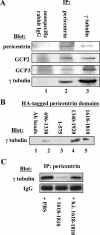
Figure 2.
Figure 2.
Pericentrin interacts with the γ TuRC in Xenopus extracts. (A) Immunoprecipitation of endogenous pericentrin pulls down γ TuRC proteins (γ tubulin, GCP2, and GCP3) from Xenopus extracts (lane 2) and immunoprecipitation of γ tubulin pulls down pericentrin (lane 3), whereas nonspecific rabbit IgG precipitates none of these proteins (lane 1). (B) HA-tagged C-terminal domains of pericentrin bound to anti-HA beads pull down endogenous γ tubulin from Xenopus extracts (lanes 4 and 5), whereas beads alone and HA-tagged central and amino-terminal domains do not pull down significant γ tubulin (lanes 1–3). (C) A C-terminal domain of pericentrin (1618–1810) disrupts the interaction between endogenous pericentrin and the γ TuRC in extracts as shown by immunoprecipitation with anti-pericentrin antibodies, whereas heat-inactivated protein (h.i. 1618–1810) and phosphate-buffered saline (PBS) have no effect. Numbers in B and C represent amino acid numbers of pericentrin.
Figure 4.
Figure 4.
C-terminal fragments of pericentrin disrupt aster formation and stability and γ tubulin assembly onto centrosomes in Xenopus mitotic extracts. (A and B) Mitotic asters assembled in the presence of equal amounts of pericentrin 1340–1920 (B) or heat inactivated (h.i.) 1340–1920 (A). (C) Mitotic aster assembly in the presence of increasing concentrations of pericentrin (Pc) 1340–1920. (D) Quantification of aster assembly in mitotic extracts in the presence of pericentrin domains. Amount of protein added per 10 μl of extract is indicated. (1, PBS; 2, 33 ng of 1–535; 3, 12 ng of 1340–1920 (p < 0.0001); 4, 12 ng of h.i. 1340–1920; 5, 10 ng of peri B1826–2117; 6, 10,000 ng of BSA). Quantification of aster assembly in interphase extracts (D7–9) by using a pericentrin domain (1618–1810) that inhibits aster assembly in mitotic extracts (7. p < 0.0001) and is inactivated by heat (8), but has no activity in interphase extracts in the same experiment (9). (E and F) γ Tubulin assembly onto nascent centrosomes in the presence of h.i. 1340–1920 (E) or 1340–1920 (F, p < 0.0001). (G) Quantification of γ tubulin assembly onto centrosomes in the absence of mitotic extract (1), in extracts with 1–595 (2), 1340–1920 (3, p < 0.0001), 1618–1810 (4, p < 0.0001), or heat inactivated 1618–1810 (5). For C, D, and G, 200 sperm nuclei were counted per bar or point. (H–K) Rapid disassembly of preassembled mitotic asters over time after addition of 1340–1920. (L) h.i. Pc 1340–1920 has no effect on preassembled asters. (M and N) Ran-mediated aster assembly in extracts in the presence of h.i 1618–1810 (M) or 1618–1810 (N). A–D, H–N, microtubules or γ tubulin, red; nuclei, green. Bar (A), 10 μm for A and B; in L, 10 μm for H–N.
Figure 5.
Figure 5.
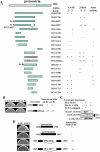
Summary of GCP2/3 binding and aster inhibitory activity of pericentrin domains. (A) Binding and aster activity of various pericentrin constructs. CoIP, coimmunoprecipitation; 2-hyb, yeast two-hybrid; aster, aster inhibitory activity; consensus, smallest domain identified in both coIP and 2-hyb that has high-affinity binding activity to both GCP2 and GCP3; XX, E to A mutations in 1613 and 1615, Pc B φ 1973–2037 lacks an exon encoding the indicated amino acids. Although variable, interactions of all affinities were scored as + unless they were at the limit of detection (then scored as +/-). No markings such as + or - denote data not acquired for these parameters. Proteins were considered positive in the aster inhibition assay if they showed at least 31% reduction in aster assembly relative to control activity. For clarity, the pericentrin B constructs are arbitrarily sized and aligned with homologous regions of pericentrin. (B) Yeast two-hybrid data showing significantly reduced binding of mutant pericentrin domain for GCP2 and GCP3. (C) Cooverexpression, coimmunoprecipitation data showing enhanced binding of GCP2 to pericentrin 1–1920 in the presence of GCP3 (see Figure 2 legend for details). Con, control. (D) Yeast two-hybrid data showing binding of GCP2 by a pericentrin A fragment and lack of GCP2 binding by the homologous pericentrin B fragment as well as mutants lacking a pericentrin B specific exon (see MATERIALS AND METHODS for details).
Figure 3.
Figure 3.
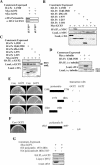
C-terminal domains of pericentrin interact with γ TuRC proteins GCP3 and GPC2 in vitro. (A) When coexpressed in vertebrate cells myc-tagged GCP2 and/or myctagged GCP3 coimmunoprecipitate with HA-tagged pericentrin (similar mobility of GCP2 and GCP3 prevents their individual identification in this experiment). (B–D) A C-terminal domain of pericentrin (amino acids 1340–1920) interacts with GCP3 (B) and GCP2 (C) but not γ tubulin (D) when coexpressed in vertebrate cells. Immunoprecipitation and immunoblotting performed as indicated. End., endogenous protein. (E) Two-hybrid analysis confirms the interaction of the pericentrin C terminus with GCP2 and GCP3 but not with γ tubulin (data not shown). (F and G) Segments of pericentrin-B corresponding to the C terminal region of pericentrin do not interact with GCP2 in two-hybrid (F) or coimmunoprecipitation experiments (G).
Figure 1.
Figure 1.
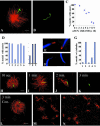
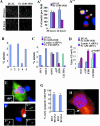
Silencing of pericentrin A and B causes mitotic defects. (A) SAOS cells with reduced pericentrin after siRNA treatment stained with a pericentrin antibody (M8, green), which recognizes both isoforms of pericentrin (Pc A/B) and DNA (DAPI, blue). (A′) Same field as in A costained for microtubules (α tubulin, red). (B) Cells with reduced lamin A stained for lamin A (green) and DNA. (B′) Same field as in B stained for centrosomes with 5051 autoimmune sera (green) and microtubules (red). (C and C′) Cells with reduced pericentrin B (targeting the C-terminal PACT domain) stained with pericentrin B-specific antibody, Pc B, (C, green), together with microtubule label (C′) or pericentrin antibody that recognizes both isoforms (C″). (A, B, C, and C″) Maximum projection of z series without deconvolution. (A′, B′, and C′) Maximum projection of deconvolved z series. Note the improvement in the resolution of the DNA. Arrows indicate cells expressing near normal levels of the targeted protein. (D) Western blots of crude cell lysates demonstrating reduction of pericentrin B (Pc B) but not pericentrin A (Pc) by using Pc B-specific siRNA or reduction of both isoforms relative to lamin A siRNA control, by siRNA targeting Pc A and Pc B (Pc A/B). Pericentrin isoforms probed with Pc A/B anti-pericentrin antibody (M8). α Tubulin loading control probed with DM1α anti-alpha tubulin antibody. (E) Graph showing percentage of mitotic SAOS cells with spindle defects (monopolar, multipolar, and reduced astral microtubules) at 48 and 72 h after siRNA treatment. One hundred to 150 mitotic cells scored per bar. (F) Graph indicating percentage of mitotic cells with monopolar spindles at 48 and 72 h. (G) Cells with reduced pericentrin A/B (Pc A/B, red) retain the centriole marker GT335 (green) in interphase and mitosis. (H) γ Tubulin in cells with reduced pericentrin A/B seems largely unchanged at centrosomes in interphase but is reduced at spindle poles. Pc A/B (red), γ tubulin (GTU88, green), and DAPI (blue). (G–H) Maximum projection of z series with no neighbor deconvolution. Arrows indicate cells with near normal staining levels of pericentrin. Asterisks indicate mitotic cells. Mitotic cells are show at higher magnification in insets.
Figure 1.
Figure 1.
Silencing of pericentrin A and B causes mitotic defects. (A) SAOS cells with reduced pericentrin after siRNA treatment stained with a pericentrin antibody (M8, green), which recognizes both isoforms of pericentrin (Pc A/B) and DNA (DAPI, blue). (A′) Same field as in A costained for microtubules (α tubulin, red). (B) Cells with reduced lamin A stained for lamin A (green) and DNA. (B′) Same field as in B stained for centrosomes with 5051 autoimmune sera (green) and microtubules (red). (C and C′) Cells with reduced pericentrin B (targeting the C-terminal PACT domain) stained with pericentrin B-specific antibody, Pc B, (C, green), together with microtubule label (C′) or pericentrin antibody that recognizes both isoforms (C″). (A, B, C, and C″) Maximum projection of z series without deconvolution. (A′, B′, and C′) Maximum projection of deconvolved z series. Note the improvement in the resolution of the DNA. Arrows indicate cells expressing near normal levels of the targeted protein. (D) Western blots of crude cell lysates demonstrating reduction of pericentrin B (Pc B) but not pericentrin A (Pc) by using Pc B-specific siRNA or reduction of both isoforms relative to lamin A siRNA control, by siRNA targeting Pc A and Pc B (Pc A/B). Pericentrin isoforms probed with Pc A/B anti-pericentrin antibody (M8). α Tubulin loading control probed with DM1α anti-alpha tubulin antibody. (E) Graph showing percentage of mitotic SAOS cells with spindle defects (monopolar, multipolar, and reduced astral microtubules) at 48 and 72 h after siRNA treatment. One hundred to 150 mitotic cells scored per bar. (F) Graph indicating percentage of mitotic cells with monopolar spindles at 48 and 72 h. (G) Cells with reduced pericentrin A/B (Pc A/B, red) retain the centriole marker GT335 (green) in interphase and mitosis. (H) γ Tubulin in cells with reduced pericentrin A/B seems largely unchanged at centrosomes in interphase but is reduced at spindle poles. Pc A/B (red), γ tubulin (GTU88, green), and DAPI (blue). (G–H) Maximum projection of z series with no neighbor deconvolution. Arrows indicate cells with near normal staining levels of pericentrin. Asterisks indicate mitotic cells. Mitotic cells are show at higher magnification in insets.
Figure 6.
Figure 6.
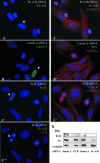
GCP2/3 binding domain of pericentrin affects astral microtubules and spindle organization in vertebrate cells. (A) Interphase cell expressing pericentrin 1680–1810 (inset, top right) shows no difference in microtubule organization compared with surrounding control cells (red, microtubules; blue, DNA stained with DAPI; yellow, 5051 centrosome staining). (B and B′) Control mitotic cell expressing β-galactosidase. (C and C′) Cell expressing pericentrin 1340–1920 and spindles with reduced astrals and pole-to-pole distance (C′, compare with B and B′). Insets at bottom right of B′, C′ show protein expression. (D) β-Galactosidase–expressing control cell. (E) Cell expressing pericentrin 1680–1810 shows reduced γ tubulin at spindle poles (compare with D). D and E, γ tubulin (red), DNA (blue), insets show 5051 staining. (F) β-Galactosidase–expressing cell. (G) Cell expressing 1680–1810 (inset, bottom right) shows reduced astral microtubules and decreased pole-to-pole distance compared with F. DNA, insets, left. Overexpressed protein, insets, right. (H) Monopolar spindle in cell expressing 1680–1810 showing centrosomes (yellow, 5051) and microtubules (H) or DNA (H′). (I) Spindle from cell expressing 1680–1810 with one tiny spindle pole (arrowhead, 5051) and unfocused microtubules at this pole (I′, merge, I″). (J) Telophase cell expressing 1680–1810 undergoing tripolar division. One nascent daughter cell lacks a centrosome (bottom). Images at right show protein expression (top), microtubules (middle) and centrosomes (bottom). (A–J) Immunofluorescence images of SAOS cells. All images except H and H′ are shown with deconvolution. Paired images were stained in parallel and collected on the same day, without modification to the laser or acquisition settings between images. (K–K″) Graphs showing percentage of transfected mitotic SAOS cells with total mitotic defects (K), monopolar spindles (K′), and reduced or absent astral microtubules (K″) 1–3, 20 h posttransfection; 4–6, 40 h posttransfection. 1, nontransfected mitotics, n = 368; 2, βgal, n = 82; 3, 1618–1810, n = 31; 4, Peri B 1826–2117; n = 95. 5, βgal, n = 39. 6; 1618–1810, n = 14. p values comparing βgal- and 1618–1810–expressing cells were calculated using the Student's t test for both time points. K, p < 0.0001 at 22 h; p < 0.0001 at 44 h. K′, p = 0.049 at 22 h; p < 0.0001 at 44 h. (L) Soluble pericentrin is more abundant in mitotic cells. Western blot of HeLa whole cell lysates from asynchronous cells (lane 1), from cells treated 4 h with nocodazole (lane 2), and from mitotic cells after shake-off (lane 3). Total protein loads were normalized for each lane using the Bio-Rad protein assay.
Figure 7.
Figure 7.
Overexpression of GCP2/3 binding domain or silencing of Pc A/B induces cell cycle arrest and apoptosis at the G2/M phase of the cell cycle. (A) Cells expressing the GCP2/3 binding domain are lost through apoptosis. Low-magnification image of COS cells stained with DAPI showing cell loss when 1340–1920 is expressed for 44 h compared with nonexpressing cells (20 h) or β-galactosidase (βgal)–expressing cells. (A′) Quantification of cells in A (mean and SD, 10 fields). (A″) Image of COS cells from A stained for DNA (blue), 1340–1920 (red) and M30 cytodeath (green). Arrows, cells with both 1340–1920 and M30. (B) Mitotic index of U2OS cells expressing: 1, βgal; 2, 1618–1810 p < 0.001; 3, Pc B1826–2117 p = 0.437; 5, 1572–1816 p = 0.011; 6, 1572–1816m p = 0.226 (n = 1000 cells/bar at 40–44 h posttransfection). p values were calculated using the t-test relative to βgal controls). (C) Mitotic index in indicated cell types overexpression the indicated constructs or treated with siRNA. p values calculated as described above: COS, p < 0.001; U2OS, p < 0.001; SAOS, p = 0.479; Mefp53-/-, p = 0.001; NIH3T3 (siRNA), p = 0.0004. (D) Cells expressing GCP2/3 binding domain constructs or treated with Pc A/B siRNA have a greater proportion of late G2 cells. Shown are mean and SD of three experiments or p value based upon scoring from 1000 treated cells. Cells immunostained for overexpressed protein (green), phosphorylate histone H3 (PH3, red), and DAPI (blue). (E) Antephase cell overexpressing 1340–1920 (stains for phosphorylated histone H3 and does not show condensed chromatin). Inset, DAPI. (F) Apoptotic antephase cells expressing 1340–1920. M30 (red), phosphorylated histone H3 (green; inset, bottom right), DNA (blue; inset, above), overexpressed protein (inset, bottom left). (G) Graph showing that most early apoptotic cells expressing GCP2/3 binding domains stain for phosphorylated histone H3. Shown are mean, SD, n = 3 experiments. (H) Early apoptotic cell expressing 1340–1920 stained for centrosomes (5051, green), DNA (blue), HA pericentrin (red), M30, yellow. Inset 5051. Imaged as in Figure 5.
Figure 8.
Figure 8.
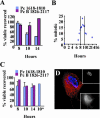
COS cells expressing Pc1618–1810 undergo apoptosis during the G2/M transition. (A) Cells expressing 1618–1810 undergo apoptosis at mitosis. Microinjected cells released from a double thymidine block were stained for DNA (DAPI) and overexpressed protein (250 cells/bar). 1618–1810–expressing cells were apoptotic or detached 8–10 h after injection, whereas control cells (Pc B1826–2117) increased in number. At 14 h, p value comparing the two treatments, p < 0.0001 (B) Mitotic index of COS cells after release from double thymidine block as in A (peak, 9 h). (C) 1618–1810–expressing cells arrested in S phase do not undergo apoptosis. Microinjected cells retained in thymidine for the times indicated. No loss of cells was observed 8–14 h later. 10*, microinjected cells arrested in S phase for 6 h and then released from the block for 4 h (10 h total, p = 0.25). (D) Immunofluorescence image of an apoptotic cell expressing 1618–1810 at 10 h postinjection as in A. D (overlay), DNA (blue and upper inset), M30 (red), overexpressed protein (lower inset).

Similar articles

Cited by

References

    1. Barbosa, V., Gatt, M., Rebollo, E., Gonzalez, C., and Glover, D.M. (2003). Drosophila dd4 mutants reveal that gammaTuRC is required to maintain juxtaposed half spindles in spermatocytes. J. Cell Sci. 116, 929-941. - PubMed
    1. Barbosa, V., Yamamoto, R.R., Henderson, D.S., and Glover, D.M. (2000). Mutation of a Drosophila gamma tubulin ring complex subunit encoded by discs degenerate-4 differentially disrupts centrosomal protein localization. Genes Dev. 14, 3126-3139. - PMC - PubMed
    1. Blagden, S.P., and Glover, D.M. (2003). Polar expeditions–provisioning the centrosome for mitosis. Nat. Cell Biol. 5, 505-511. - PubMed
    1. Bobinnec, Y., Khodjakov, A., Mir, L.M., Rieder, C.L., Edde, C.L., and Bornens, M. (1998). Centriole disassembly in vivo and its effect on centrosome structure and function in vertebrate cells. J. Cell Biol. 143, 1575-1589. - PMC - PubMed
    1. Casenghi, M., Meraldi, P., Weinhart, U., Duncan, P.I., Korner, R., and Nigg, E.A. (2003). Polo-like kinase 1 regulates Nlp, a centrosome protein involved in microtubule nucleation. Dev. Cell. 5, 113-125. - PubMed

Publication types

LinkOut - more resources