. 2004 Jun;78(11):5973-82.
doi: 10.1128/JVI.78.11.5973-5982.2004.

Intracellular topology and epitope shielding of poliovirus 3A protein

Affiliations

Intracellular topology and epitope shielding of poliovirus 3A protein

Sunny S Choe et al. J Virol. 2004 Jun.

Abstract

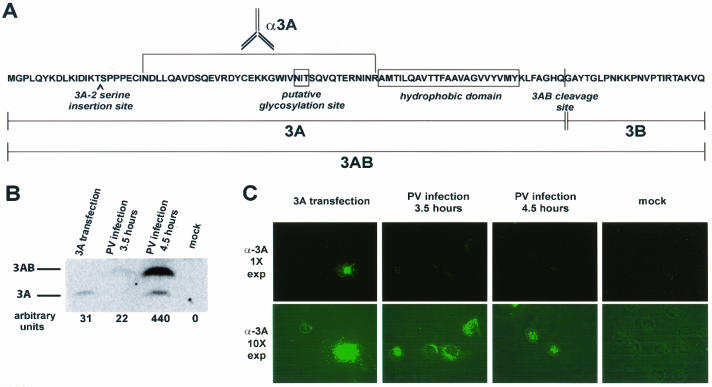
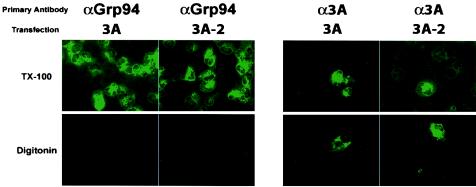
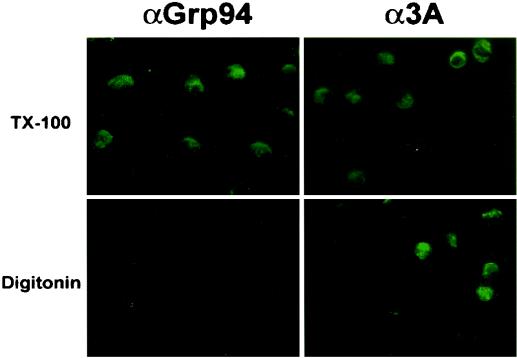
The poliovirus RNA replication complex comprises multiple viral and possibly cellular proteins assembled on the cytoplasmic surface of rearranged intracellular membranes. Viral proteins 3A and 3AB perform several functions during the poliovirus replicative cycle, including significant roles in rearranging membranes, anchoring the viral polymerase to these membranes, inhibiting host protein secretion, and possibly providing the 3B protein primer for RNA synthesis. During poliovirus infection, the immunofluorescence signal of an amino-terminal epitope of 3A-containing proteins is markedly shielded compared to 3A protein expressed in the absence of other poliovirus proteins. This is not due to luminal orientation of all or a subset of the 3A-containing polypeptides, as shown by immunofluorescence following differential permeabilization and proteolysis experiments. Shielding of the 3A epitope is more pronounced in cells infected with wild-type poliovirus than in cells with temperature-sensitive mutant virus that contains a mutation in the 3D polymerase coding region adjacent to the 3AB binding site. Therefore, it is likely that direct binding of the poliovirus RNA-dependent RNA polymerase occludes the amino terminus of 3A-containing polypeptides in the RNA replication complex.


Figures

FIG. 1.
FIG. 1.
Expression of 3A protein in transfected and infected COS cells. COS cells were plated onto coverslips and either transfected with a plasmid encoding 3A or infected with poliovirus at an MOI of 20 PFU/cell for the indicated amounts of time. The transfections and infections were performed in duplicate, and cells were processed for either indirect immunofluorescence or Western blot analysis. (A) PV 3AB amino acid sequence, with vertical bars denoting the N and C termini of 3A and 3B. (B) Western blot of cells expressing 3A from transfection or infection. Protein bands were developed on a PhosphorImager and quantified with ImageQuant software. (C) COS cells were fixed with 4% paraformaldehyde, permeabilized in 0.5 μg of digitonin per ml, and visualized with 3A monoclonal antibody followed by FITC-conjugated secondary antibody. Images obtained at 1× and 10× exposure times are shown. Fluorescence images have been overlaid with phase images in all panels.
FIG. 2.
FIG. 2.
Immunofluorescence of 3A- and 3A-2-transfected COS cells. COS cells were plated onto coverslips and transfected with the indicated construct. Cells were incubated at 37°C for 24 h and fixed in 4% paraformaldehyde. Selective permeabilization of the plasma membrane was performed in 0.5 μg of digitonin per ml. Permeabilization of all cellular membranes was performed in 0.5% Triton X-100 (TX-100). Immunofluorescence signal from 3A-containing proteins was visualized as described for Fig. 1. Fluorescence images have been overlaid with phase images in all panels.
FIG. 3.
FIG. 3.
Immunofluorescence of poliovirus-infected COS cells. COS cells were plated onto coverslips and infected with poliovirus at an MOI of 20 PFU/cell. Cells were then incubated at 37°C for 4.5 h and fixed in 4% paraformaldehyde. Selective permeabilization of the plasma membrane was performed in 0.5 μg of digitonin per ml. Permeabilization of all cellular membranes was performed in 0.5% Triton X-100 (TX-100). Fluorescence images have been overlaid with phase images in all panels.
FIG. 4.
FIG. 4.
Proteinase K digests of poliovirus-infected COS cells. COS cells were infected with poliovirus at an MOI of 20 PFU/cell and incubated for 4.5 h at 37°C. Cells were harvested for proteolysis by hypotonically swelling and scraping the cells from the tissue culture dish to selectively permeabilize the plasma membrane. Cells were washed to remove endogenous cytosolic components and resuspended in PBS in the absence (top portions of panels A to C) or presence (bottom portions of panels A to C) of 0.5% Triton X-100. Cells were incubated with increasing amounts of proteinase K (A to C: lane 1, 0 ng; lane 2, 10 ng; lane 3, 25 ng; lane 4, 50 ng; lane 5, 100 ng; lane 6, 250 ng; lane 7, 500 ng; lane 8, 1,000 ng) for 15 min at 37°C. Proteolysis was stopped by adding phenylmethylsulfonyl fluoride and sample buffer containing dithiothreitol and β-mercaptoethanol, followed by boiling for 5 min. Samples were run on SDS-PAGE gels, transferred to polyvinylidene difluoride membranes, probed with the indicated antibodies, and developed on a PhosphorImager to determine protease susceptibility. Proteinase K digests of Grp94 (A), a luminal ER marker, GFP-HO-2 (B), a cytosolic ER marker, and 3AB and 3A (C) are shown. Quantitation and graphing (D to F) were performed with ImageQuant and GraphPad Prism software.
FIG. 5.
FIG. 5.
Analysis of 3A protein during poliovirus and rVV-3A,GFP infection. COS cells were plated onto coverslips and mock infected or infected with either poliovirus or recombinant vaccinia virus, expressing 3A protein (rVV-3A,GFP), at an MOI of 20 PFU/cell and incubated at 37°C for the indicated amounts of time. All infections were performed in duplicate, and cells were processed for either indirect immunofluorescence or Western blot analysis. (A and B) COS cells were fixed with 4% paraformaldehyde, permeabilized in 0.5 μg of digitonin per ml, and stained with 3A monoclonal antibody followed by Texas Red-conjugated secondary antibody. Coverslips were mounted on slides with Vectashield and viewed on a fluorescent microscope with ImagePro software. Fluorescence images have been overlaid with phase images in all panels. (C) Western blot of 3AB and 3A expression during poliovirus or recombinant vaccinia virus infection over time. Protein bands were developed on a PhosphorImager and quantitated with ImageQuant software. The numbers below the lanes indicate relative intensities of the bands in each lane. Numbers for poliovirus infections are the sums of the 3AB and 3A bands.
FIG. 6.
FIG. 6.
Immunofluorescence of 3A protein during wild-type and 3D-M394T mutant poliovirus infection. COS cells were plated onto coverslips and infected at an MOI of 20 PFU/ml with either wild-type poliovirus or 3D-M394T, a temperature-sensitive mutant poliovirus (4). Infections were carried out at 32.5°C for 4 h, followed by the addition of 2 mM guanidine to inhibit RNA replication and further incubation at 39.5°C, the nonpermissive temperature for the M394T mutant virus, as indicated. All infections were performed in duplicate, and cells were processed for indirect immunofluorescence or immunoblot analysis. (A) COS cells were fixed, permeabilized in digitonin, and stained with 3A monoclonal antibody followed by FITC-conjugated secondary antibody. Fluorescence images have been overlaid with phase images in all panels. (B) Quantitation of the average fluorescence intensity per cell during either wild-type or M394T mutant poliovirus infection at the indicated times after the temperature shift. Fluorescence intensities of 35 to 70 cells per experiment were measured with Metamorph software (Universal Imaging Corporation). Data for each cell were plotted and overlaid onto a box plot of the first and third quartiles and the median, with error bars. Quartiles and box plots were made with R Lab 1 statistical analysis software (http://cran.r-project.org).
FIG. 7.
FIG. 7.
Model of the oligomeric polymerase lattice bound to membrane-associated 3AB in a poliovirus-infected cell. A model for the mechanism of 3A epitope shielding, via the interaction between 3AB and a higher-order polymerase structure, is shown. 3AB is represented as a globular, integral membrane protein (green). 3D polymerase molecules, forming contacts along an interface observed in the three-dimensional structure interface I (21) are shown in dark blue and light blue. This view does not indicate a second interface, which may form between these fibers of polymerase molecules to give rise to two-dimensional lattices (29). The surface of 3D polymerase known to interact with 3AB through the 3AB binding site (22, 30) is shown in orange. Every second polymerase molecule could directly contact membrane-associated 3AB. Coordinates for the unit cell of the three-dimensional poliovirus RNA-dependent RNA polymerase (21) were provided by J. Hansen (Yale University) and S. Schultz (Diné College) and can be obtained from the National Center for Biotechnology Information library under PDB identification number 1RDR. This figure was kindly provided by Joanna Boerner (Stanford University).

Similar articles

Cited by

References

    1. Aldabe, R., A. Barco, and L. Carrasco. 1996. Membrane permeabilization by poliovirus proteins 2B and 2BC. J. Biol. Chem. 271:23134-23137. - PubMed
    1. Balch, W. E., K. R. Wagner, and D. S. Keller. 1987. Reconstitution of transport of vesicular stomatitis virus G protein from the endoplasmic reticulum to the Golgi complex using a cell-free system. J. Cell Biol. 104:749-760. - PMC - PubMed
    1. Barco, A., and L. Carrasco. 1995. A human virus protein, poliovirus protein 2BC, induces membrane proliferation and blocks the exocytic pathway in the yeast Saccharomyces cerevisiae. EMBO J. 14:3349-3364. - PMC - PubMed
    1. Barton, D. J., B. J. Morasco, L. Eisner-Smerage, P. S. Collis, S. E. Diamond, M. J. Hewlett, M. A. Merchant, B. J. O'Donnell, and J. B. Flanegan. 1996. Poliovirus RNA polymerase mutation 3D-M394T results in a temperature-sensitive defect in RNA synthesis. Virology 217:459-469. - PubMed
    1. Beckers, C. J., D. S. Keller, and W. E. Balch. 1989. Preparation of semiintact Chinese hamster ovary cells for reconstitution of endoplasmic reticulum-to-Golgi transport in a cell-free system. Methods Cell Biol. 31:91-102. - PubMed

Publication types

LinkOut - more resources