. 2004 May 11;43(18):5138-48.
doi: 10.1021/bi035213q.

Poliovirus RNA-dependent RNA polymerase (3Dpol): pre-steady-state kinetic analysis of ribonucleotide incorporation in the presence of Mn2+

Affiliations

Poliovirus RNA-dependent RNA polymerase (3Dpol): pre-steady-state kinetic analysis of ribonucleotide incorporation in the presence of Mn2+

Jamie J Arnold et al. Biochemistry. .

Abstract

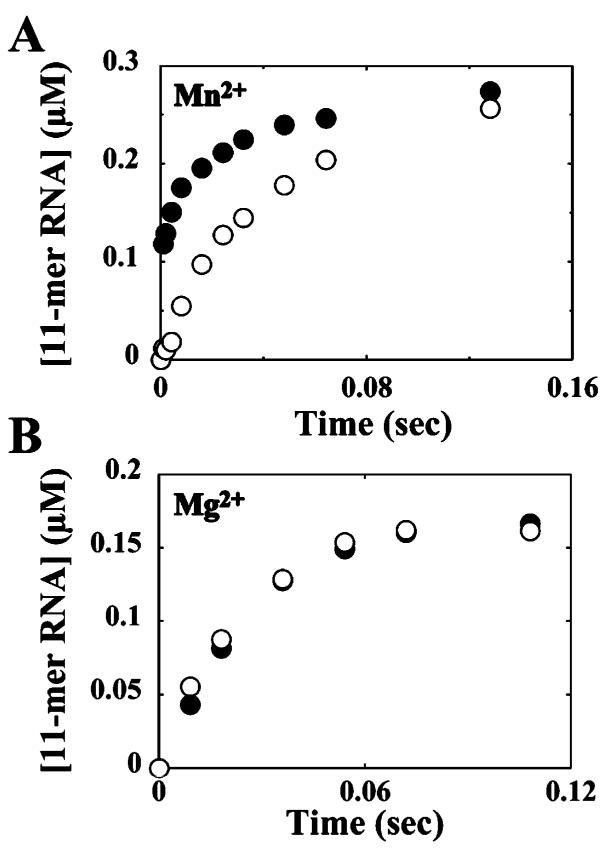
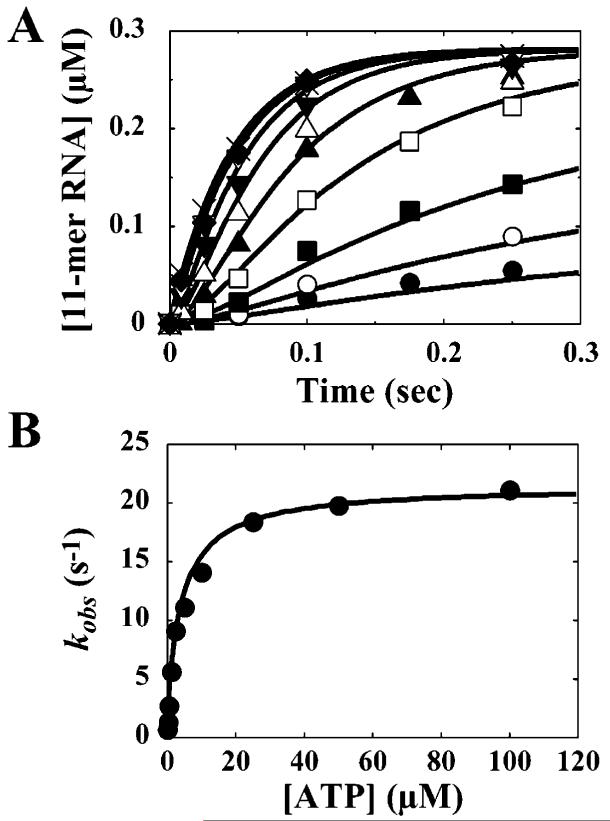
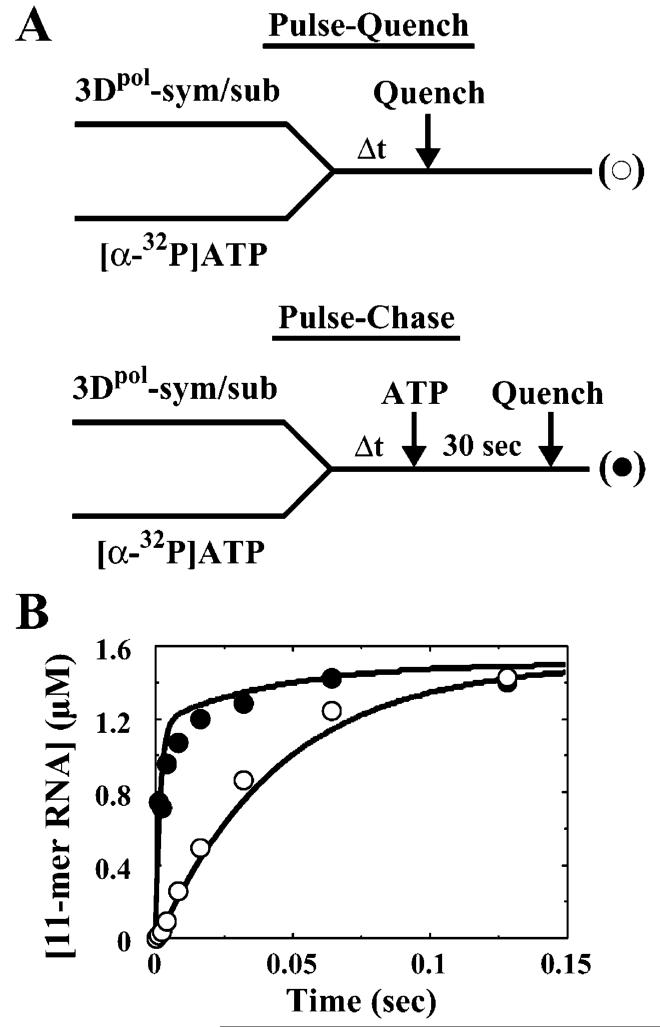
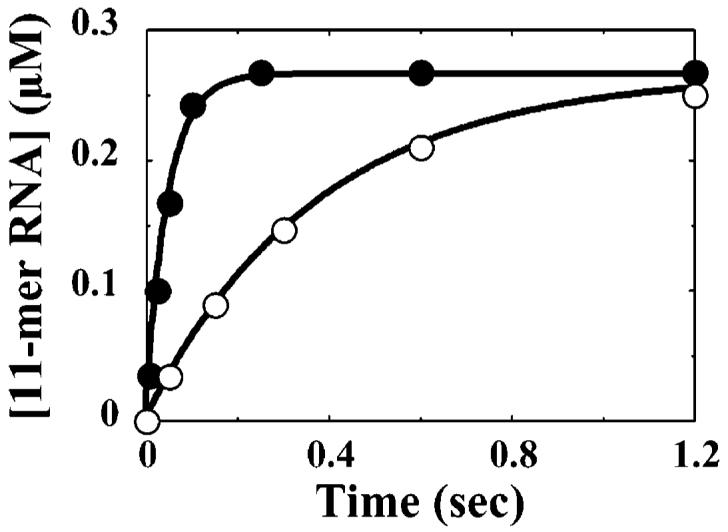
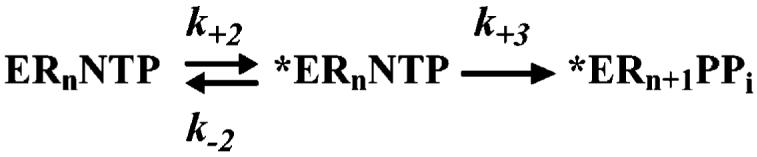
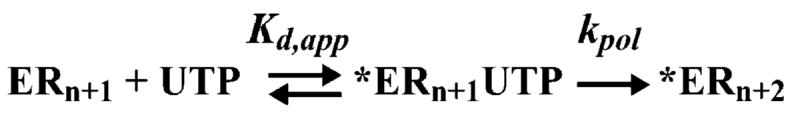
The use of Mn(2+) as the divalent cation cofactor in polymerase-catalyzed reactions instead of Mg(2+) often diminishes the stringency of substrate selection and incorporation fidelity. We have solved the complete kinetic mechanism for single nucleotide incorporation catalyzed by the RNA-dependent RNA polymerase from poliovirus (3D(pol)) in the presence of Mn(2+). The steps employed during a single cycle of nucleotide incorporation are identical to those employed in the presence of Mg(2+) and include a conformational-change step after nucleotide binding to achieve catalytic competence of the polymerase-primer/template-nucleotide complex. In the presence of Mn(2+), the conformational-change step is the primary determinant of enzyme specificity, phosphoryl transfer appears as the sole rate-limiting step for nucleotide incorporation, and the rate of phosphoryl transfer is the same for all nucleotides: correct and incorrect. Because phosphoryl transfer is the rate-limiting step in the presence of Mn(2+), it was possible to determine that the maximal phosphorothioate effect in this system is in the range of 8-11. This information permitted further interrogation of the nucleotide-selection process in the presence of Mg(2+), highlighting the capacity of this cation to permit the enzyme to use the phosphoryl-transfer step for nucleotide selection. The inability of Mn(2+) to support a reduction in the efficiency of phosphoryl transfer when incorrect substrates are employed is the primary explanation for the loss of fidelity observed in the presence of this cofactor. We propose that the conformational change involves reorientation of the triphosphate moiety of the bound nucleotide into a conformation that permits binding of the second metal ion required for catalysis. In the presence of Mg(2+), this conformation requires interactions with the enzyme that permit a reduction in catalytic efficiency to occur during an attempt to incorporate an incorrect nucleotide. Adventitious interactions in the cofactor-binding site with bound Mn(2+) may diminish fidelity by compensating for interaction losses used to modulate catalytic efficiency when incorrect nucleotides are bound in the presence of Mg(2+).


Figures

FIGURE 1
FIGURE 1
The observed kinetics of 3Dpol-catalyzed nucleotide incorporation in the presence of Mn2+ is dependent upon the nature of the quench. (A) Kinetics of AMP incorporation in the presence of Mn2+ quenched by either EDTA (●) or HCl (○). 2 μM 3Dpol was incubated with 2 μM sym/sub (1 μM duplex) and rapidly mixed with 500 μM ATP (final concentration) in the presence of Mn2+ as described under Experimental Procedures. (B) Kinetics of AMP incorporation in the presence of Mg2+ quenched by either EDTA (●) or HCl (○). 2 μM 3Dpol was incubated with 2 μM sym/sub (1 μM duplex) and rapidly mixed with 500 μM ATP (final concentration) in the presence of Mg2+ as described under Experimental Procedures.
FIGURE 2
FIGURE 2
Concentration dependence of AMP incorporation into sym/sub. 2 μM 3Dpol was incubated with 2 μM sym/sub (1 μM duplex) and rapidly mixed with either 0.125 (●), 0.25 (○), 0.5 (■), 1.25 (□), 2.5 (▲), 5 (△), 10 (▼), 20 (▽), 50 (◆), or 100 (×) μM (final concentration) ATP as described under Experimental Procedures. The solid lines represent the kinetic simulation of the mechanism shown in Scheme 1 with the kinetic parameters shown in Table 5. (B) kobs as a function of ATP concentration obtained from the reactions described in (A). The solid line represents the fit of the data to a hyperbola with a Kd,app for ATP of 4.1 ± 0.5 μM and a kpol of 21.4 ± 0.6 s-1.
FIGURE 3
FIGURE 3
Intermediate identification by pulse-chase analysis. (A) Experimental design. 4 μM 3Dpol was incubated with 20 μM sym/sub (10 μM duplex) and rapidly mixed with 130 μM [α-32P]ATP (3.8 Ci/mmol) (final concentration) as described under Experimental Procedures. At the indicated times, reactions were either chased by addition of ATP to a final concentration of 20 mM or quenched by addition of HCl to a final concentration of 1 M. After addition of the chase solution, the reaction was allowed to proceed for an additional 30 s, at which time the reaction was quenched by addition of HCl to a final concentration of 1 M. Immediately after addition of HCl, the solution was neutralized by addition of 1 M KOH and 300 mM Tris. (B) Kinetics of pulse-chase (●) and pulse-quench (○) from the reactions described in (A). The solid lines represent the kinetic simulation of the data fit to the mechanism shown in Scheme 1 with the kinetic parameters shown in Table 5. The simulated curve of the pulse-quench data predicts the rate of formation of all Rn+1-containing species; the simulated curve of the pulse-chase data predicts the rate of formation of *ERnNTP and all Rn+1-containing species.
FIGURE 4
FIGURE 4
Elemental effect on the pre-steady-state burst rate of AMP incorporation. (A) 2 μM 3Dpol was incubated with 2 μM sym/sub (1 μM duplex) and rapidly mixed with either 100 μM ATP (●) or 100 μM ATPαS (○) (final concentration) as described under Experimental Procedures. The solid lines represent the fit of the data to a single exponential with a kobs for ATP of 20.4 ± 0.8 s-1 and a kobs for ATPαS of 2.67 ± 0.04 s-1.
FIGURE 5
FIGURE 5
Multiple nucleotide incorporation in the absence and presence of pyrophosphate. (A) 2 μM 3Dpol was incubated with 2 μM sym/sub (1 μM duplex) and rapidly mixed with 4 μM ATP and 7 μM UTP (final concentration) as described under Experimental Procedures. Key: Kinetics of formation and disappearance of 11-mer (●) and 12-mer (○). The solid lines represent the kinetic simulation of the data fit to a mechanism for two successive nucleotide incorporations with the first nucleotide incorporation described by the kinetic mechanism shown in Scheme 1 using the kinetic parameters in Table 5 and the second nucleotide incorporation described by the mechanism shown in Scheme 4 using the Kd,app and kpol values for UTP using sym/sub-UA shown in Table 1. (B) 2 μM 3Dpol was incubated with 2 μM sym/sub (1 μM duplex) and rapidly mixed with 4 μM ATP, 7 μM UTP, and 1000 μM PPi (final concentration) as described under Experimental Procedures. Key: Kinetics of formation and disappearance of 11-mer (●) and 12-mer (○). The solid lines represent the kinetic simulation of the data fit to a mechanism for two successive nucleotide incorporations with the first nucleotide incorporation described by the kinetic mechanism shown in Scheme 1 using the kinetic parameters in Table 5 and the second nucleotide incorporation described by the mechanism shown in Scheme 4 using the Kd,app and kpol values for UTP using sym/sub-UA shown in Table 1.
FIGURE 6
FIGURE 6
The amount of intermediate that accumulates prior to chemistry for incorrect nucleotide incorporation is reduced relative to correct incorporation. (A) Kinetics of AMP incorporation in the presence of Mn2+ quenched by either EDTA (●) or HCl (○). The solid line represents the kinetic simulation of the data fit to the mechanism shown in Scheme 2 with K2 equal to 3 and k+3 equal to 30 s-1. 2 μM 3Dpol was incubated with 2 μM sym/sub (1 μM duplex) and rapidly mixed with 500 μM ATP (final concentration) as described under Experimental Procedures. (B) Kinetics of 2′-dAMP incorporation in the presence of Mn2+ quenched by either EDTA (●) or HCl (○). The solid line represents the kinetic simulation of the data fit to the mechanism shown in Scheme 2 with K2 equal to 0.4 and k+3 equal to 30 s-1. The dotted line represents the kinetic simulation of the data fit to the mechanism shown in Scheme 2 with K2 equal to 3 and k+3 equal to 10 s-1. 2 μM 3Dpol was incubated with 2 μM sym/sub (1 μM duplex) and rapidly mixed with 500 μM 2′-dATP (final concentration) as described under Experimental Procedures. (C) Kinetics of GMP incorporation in the presence of Mn2+ quenched by either EDTA (●) or HCl (○). The solid line represents the kinetic simulation of the data fit to the mechanism shown in Scheme 2 with K2 equal to 0.05 and k+3 equal to 30 s-1. The dotted line represents the kinetic simulation of the data fit to the mechanism shown in Scheme 2 with K2 equal to 3 and k+3 equal to 3 s-1. 2 μM 3Dpol was incubated with 2 μM sym/sub (1 μM duplex) and rapidly mixed with 1000 μM GTP (final concentration) as described under Experimental Procedures.
FIGURE 7
FIGURE 7
Comparison of the free energy profile for correct and incorrect 3Dpol-catalyzed nucleotide incorporation in the presence of Mg2+ and Mn2+. (A) Free energy profile in the presence of Mg2+. The free energy profile for correct and incorrect nucleotide incorporation is shown as follows: solid line for AMP incorporation, small dotted line for 2′-dAMP incorporation, and large dotted line for GMP incorporation. (B) Free energy profile in the presence of Mn2+. The free energy profile for correct and incorrect nucleotide incorporation is shown as follows: solid line for AMP incorporation, small dotted line for 2′-dAMP incorporation, and large dotted line for GMP incorporation. The concentrations of the substrates and products used were 2000 μM NTP and 20 μM PPi. The free energy for each reaction step was calculated from ΔG = RT[ln-(kT/h) - ln(kobs)], where R is 1.99 cal K-1 mol-1, T is 303 K, k is 3.30 × 10⁻²⁴ cal K-1, h is 1.58 × 10⁻³⁴ cal s, and kobs is the first-order rate constant. The free energy for each species was calculated from ΔG = RT[ln(kT/h) - ln(kobs,for)] - RT[ln(kT/h) - ln(kobs,rev)].
FIGURE 8
FIGURE 8
Structural model for 3Dpol-catalyzed nucleotide incorporation. (A) Ground-state binding of metal-complexed nucleotide. (B) Reorientation of the triphosphate into the catalytically competent configuration. (C) Binding of the second metal ion. (D) Phosphoryl transfer and pyrophosphate release. While the kinetic mechanism suggests a conformational change prior to pyrophosphate release, our data do not provide any information to permit a molecular description of this step. Images were generated from the model previously described (18). Nucleotide and side chain motions were derived from ref by approximate rotation and translation movements. Atom colors correspond to the following: red, oxygen; blue, nitrogen; gray, carbon; magenta, Mg2+ or Mn2+. The images were rendered with WebLab Viewer Pro (Accelrys Inc., San Diego, CA).
Scheme 1
Scheme 1
Complete Kinetic Mechanism for 3Dpol-Catalyzed Nucleotide Incorporationa a Abbreviations: ERn, 3Dpol-sym/sub complex; NTP, nucleotide; ERnNTP, ternary complex; *ERnNTP, activated elongation complex; *ERn+1PPi, activated product complex; ERn+1PPi, product complex; ERn+1, 3Dpol sym/sub product complex; PPi, pyrophosphate.
Scheme 2
Scheme 2
Minimal Mechanism for Pulse-Chase Analysisa a Abbreviations: ERnNTP, ternary complex; *ERnNTP, activated elongation complex; ERn+1PPi, product complex.
Scheme 3
Scheme 3
Minimal Kinetic Mechanism for Consecutive Incorporation of Two Nucleotides by 3Dpol a a Abbreviations: ERn, 3Dpol-sym/sub complex; ATP, adenosine 5′-triphosphate; *ERnATP, activated elongation complex; *ERn+1, activated product complex 1; ERn+1, product complex; UTP, uridine 5′-triphosphate; *ERn+1UTP, activated elongation product complex 1; *ERn+2, activated product complex 2.
Scheme 4
Scheme 4
Minimal Kinetic Mechanism for UMP Incorporation into sym/sub-UA by 3Dpol a a Abbreviations: ERn+1, product complex; UTP, uridine 5′-triphosphate; *ERn+1UTP, activated elongation product complex 1; *ERn+2, activated product complex 2.

Similar articles

Cited by

References

    1. Brautigam CA, Steitz TA. Structural and functional insights provided by crystal structures of DNA polymerases and their substrate complexes. Curr. Opin. Struct. Biol. 1998;8:54–63. - PubMed
    1. Kornberg A, Baker T. DNA Replication. 2nd ed. W. H. Freeman and Co.; New York: 1991.
    1. Grabbara S, Peliska JA. Catalytic activities associated with retroviral and viral polymerases. Methods Enzymol. 1996;275:276–310. - PubMed
    1. Tabor S, Richardson CC. Effect of manganese ions on the incorporation of dideoxynucleotides by bacteriophage T7 DNA polymerase and Escherichia coli DNA polymerase I. Proc. Natl. Acad. Sci. U.S.A. 1989;86:4076–4080. - PMC - PubMed
    1. Huang Y, Beaudry A, McSwiggen J, Sousa R. Determinants of ribose specificity in RNA polymerization: effects of Mn2+ and deoxynucleoside monophosphate incorporation into transcripts. Biochemistry. 1997;36:13718–13728. - PubMed

Publication types

MeSH terms