

Cloning and overproduction of gibberellin 3-oxidase in hybrid aspen trees. Effects on gibberellin homeostasis and development
- PMID: 15122019
- PMCID: PMC429357
- DOI: 10.1104/pp.104.038935
Cloning and overproduction of gibberellin 3-oxidase in hybrid aspen trees. Effects on gibberellin homeostasis and development
Abstract
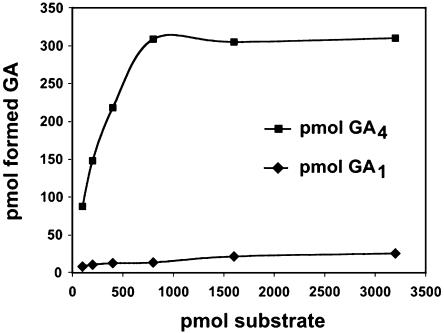
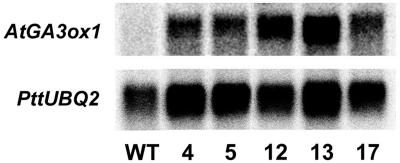
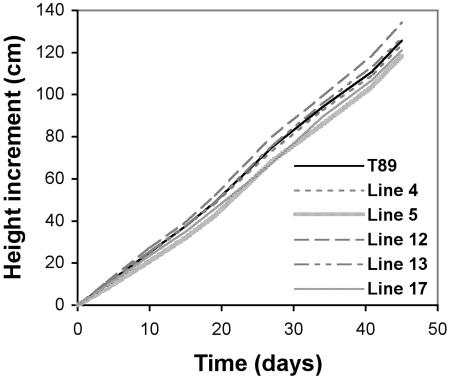
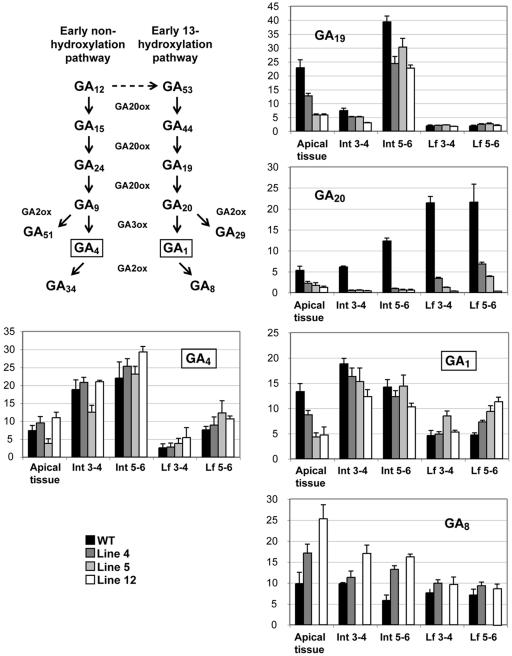
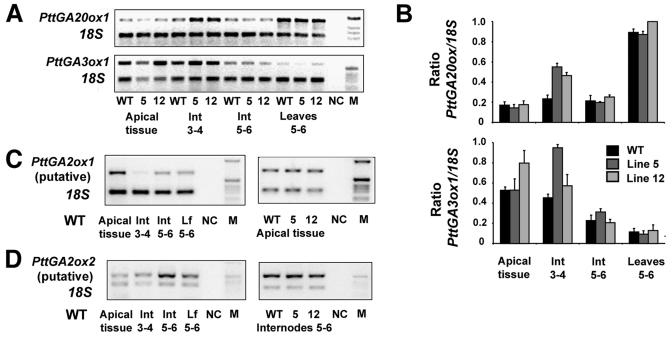
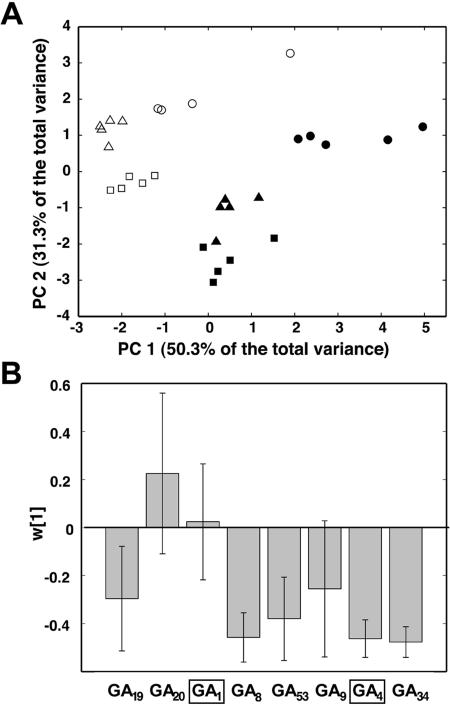
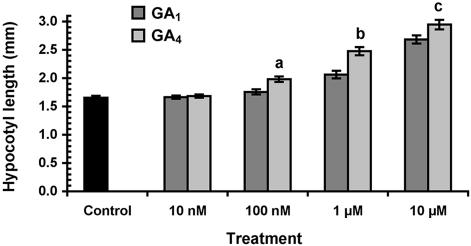
To broaden our understanding of gibberellin (GA) biosynthesis and the mechanism whereby GA homeostasis is maintained in plants, we have investigated the degree to which the enzyme GA 3-oxidase (GA3ox) limits the formation of bioactive GAs in elongating shoots of hybrid aspen (Populus tremula x Populus tremuloides). We describe the cloning of a hybrid aspen GA3ox and its functional characterization, which confirmed that it has 3beta-hydroxylation activity and more efficiently converts GA9 to GA4 than GA20 to GA1. To complement previous studies, in which transgenic GA 20-oxidase (GA20ox) overexpressers were found to produce 20-fold higher bioactive GA levels and subsequently grew faster than wild-type plants, we overexpressed an Arabidopsis GA3ox in hybrid aspen. The generated GA3ox overexpresser lines had increased 3beta-hydroxylation activity but exhibited no major changes in morphology. The nearly unaltered growth pattern was associated with relatively small changes in GA1 and GA4 levels, although tissue-dependent differences were observed. The absence of increases in bioactive GA levels did not appear to be due to feedback or feed-forward regulation of dioxygenase transcripts, according to semiquantitative reverse transcription polymerase chain reaction analysis of PttGA20ox1, PttGA3ox1, and two putative PttGA2ox genes. We conclude that 20-oxidation is the limiting step, rather than 3beta-hydroxylation, in the formation of GA1 and GA4 in elongating shoots of hybrid aspen, and that ectopic GA3ox expression alone cannot increase the flux toward bioactive GAs. Finally, several lines of evidence now suggest that GA4 has a more pivotal role in the tree hybrid aspen than previously believed.
Figures
Similar articles
-
Daylength and spatial expression of a gibberellin 20-oxidase isolated from hybrid aspen (Populus tremula L. x P. tremuloides Michx.).Planta. 2002 Apr;214(6):920-30. doi: 10.1007/s00425-001-0703-3. Epub 2001 Dec 15. Planta. 2002. PMID: 11941469
-
Analyses of GA20ox- and GID1-over-expressing aspen suggest that gibberellins play two distinct roles in wood formation.Plant J. 2009 Jun;58(6):989-1003. doi: 10.1111/j.1365-313X.2009.03836.x. Epub 2009 Feb 18. Plant J. 2009. PMID: 19228336
-
Transgenic hybrid aspen trees with increased gibberellin (GA) concentrations suggest that GA acts in parallel with FLOWERING LOCUS T2 to control shoot elongation.New Phytol. 2015 Feb;205(3):1288-1295. doi: 10.1111/nph.13144. Epub 2014 Nov 10. New Phytol. 2015. PMID: 25382585
-
Regulation of gibberellin biosynthesis by light.Curr Opin Plant Biol. 1999 Oct;2(5):398-403. doi: 10.1016/s1369-5266(99)00012-6. Curr Opin Plant Biol. 1999. PMID: 10508758 Review.
-
bZIP transcription factor RSG controls the feedback regulation of NtGA20ox1 via intracellular localization and epigenetic mechanism.Plant Signal Behav. 2011 Jan;6(1):26-8. doi: 10.4161/psb.6.1.14114. Epub 2011 Jan 1. Plant Signal Behav. 2011. PMID: 21248488 Free PMC article. Review.
Cited by
-
Gibberellin 3-oxidase gene expression patterns influence gibberellin biosynthesis, growth, and development in pea.Plant Physiol. 2013 Oct;163(2):929-45. doi: 10.1104/pp.113.225987. Epub 2013 Aug 26. Plant Physiol. 2013. PMID: 23979969 Free PMC article.
-
FLOWERING LOCUS T2 Promotes Shoot Apex Development and Restricts Internode Elongation via the 13-Hydroxylation Gibberellin Biosynthesis Pathway in Poplar.Front Plant Sci. 2022 Feb 3;12:814195. doi: 10.3389/fpls.2021.814195. eCollection 2021. Front Plant Sci. 2022. PMID: 35185961 Free PMC article.
-
Chilling of dormant buds hyperinduces FLOWERING LOCUS T and recruits GA-inducible 1,3-beta-glucanases to reopen signal conduits and release dormancy in Populus.Plant Cell. 2011 Jan;23(1):130-46. doi: 10.1105/tpc.110.081307. Epub 2011 Jan 31. Plant Cell. 2011. PMID: 21282527 Free PMC article.
-
Exogenous gibberellin altered morphology, anatomic and transcriptional regulatory networks of hormones in carrot root and shoot.BMC Plant Biol. 2015 Dec 15;15:290. doi: 10.1186/s12870-015-0679-y. BMC Plant Biol. 2015. PMID: 26667233 Free PMC article.
-
Transcriptome-Based Construction of the Gibberellin Metabolism and Signaling Pathways in Eucalyptus grandis × E. urophylla, and Functional Characterization of GA20ox and GA2ox in Regulating Plant Development and Abiotic Stress Adaptations.Int J Mol Sci. 2023 Apr 11;24(8):7051. doi: 10.3390/ijms24087051. Int J Mol Sci. 2023. PMID: 37108215 Free PMC article.
References
-
- Carrera E, Bou J, Garcia-Martinez JL, Prat S (2000) Changes in GA 20-oxidase gene expression strongly affect stem length, tuber induction and tuber yield of potato plants. Plant J 22: 247–256 - PubMed
-
- Chang S, Puryear J, Cairney J (1993) A simple and efficient method for isolating RNA from pine trees. Plant Mol Biol Report 11: 113–116
-
- Coles JP, Phillips AL, Croker SJ, Garcia-Lepe R, Lewis MJ, Hedden P (1999) Modification of gibberellin production and plant development in Arabidopsis by sense and antisense expression of gibberellin 20-oxidase genes. Plant J 17: 547–556 - PubMed
Publication types
MeSH terms
Substances
Associated data
- Actions
LinkOut - more resources
Full Text Sources
Other Literature Sources
