. 2004 Apr 26;165(2):167-73.
doi: 10.1083/jcb.200403022. Epub 2004 Apr 19.

Alternative topogenesis of Mgm1 and mitochondrial morphology depend on ATP and a functional import motor

Affiliations

Alternative topogenesis of Mgm1 and mitochondrial morphology depend on ATP and a functional import motor

Mark Herlan et al. J Cell Biol. .

Abstract

Mitochondrial morphology and inheritance of mitochondrial DNA in yeast depend on the dynamin-like GTPase Mgm1. It is present in two isoforms in the intermembrane space of mitochondria both of which are required for Mgm1 function. Limited proteolysis of the large isoform by the mitochondrial rhomboid protease Pcp1/Rbd1 generates the short isoform of Mgm1 but how this is regulated is unclear. We show that near its NH2 terminus Mgm1 contains two conserved hydrophobic segments of which the more COOH-terminal one is cleaved by Pcp1. Changing the hydrophobicity of the NH2-terminal segment modulated the ratio of the isoforms and led to fragmentation of mitochondria. Formation of the short isoform of Mgm1 and mitochondrial morphology further depend on a functional protein import motor and on the ATP level in the matrix. Our data show that a novel pathway, to which we refer as alternative topogenesis, represents a key regulatory mechanism ensuring the balanced formation of both Mgm1 isoforms. Through this process the mitochondrial ATP level might control mitochondrial morphology.


Figures
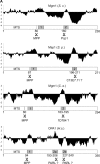
Figure 1.
Figure 1.
Balanced formation of both isoforms of Mgm1 is modulated by two consecutive hydrophobic segments. (A) Hydrophobicity plots of the NH2-termini of Mgm1 and its orthologues according to Kyte and Doolittle (1982). Numbers below indicate amino acid position after which cleavage by mitochondrial processing peptidase (MPP) or mitochondrial rhomboid protease (Pcp1, C13E7.11, 1D784, PARL) occurs. Putative rhomboid proteases and predicted cleavage regions are indicated by question mark. S.c., Saccharomyces cerevisiae; S.p., Schizosaccharomyces pombe; C.e., Caenorhabditis elegans; H.s., Homo sapiens; MTS, mitochondrial targeting sequence. For OPA1 splice variant 8 was analyzed. (B) Immunoblotting with antibodies against Mgm1 of total yeast cell extracts from Δmgm1 strains (or Δpcp1Δmgm1 strain, respectively) expressing indicated Mgm1 version. Bands corresponding to l-Mgm1 and s-Mgm1 are indicated. Mgm1 versions: WT, wild-type; Δ1, lacking first hydrophobic segment (residues 91–111); Δ2, lacking second hydrophobic segment (residues 154–167); Δ1&Δ2, lacking both hydrophobic segments; G100D, G100K, respective point mutations; VVL, three residues (GGM) at position 100–102 were replaced by VVL. (C) Mitochondrial morphology of indicated strains was scored for at least 150 cells in three experiments. The amount of cells containing a mitochondrial tubular network is expressed as percentage of the control strain expressing Mgm1. SD is indicated by the errors bars. (D) Representative fluorescence (left) and phase contrast (right) images of indicated strains expressing mitochondrially targeted GFP. Bar, 5 μm.
Figure 1.
Figure 1.
Balanced formation of both isoforms of Mgm1 is modulated by two consecutive hydrophobic segments. (A) Hydrophobicity plots of the NH2-termini of Mgm1 and its orthologues according to Kyte and Doolittle (1982). Numbers below indicate amino acid position after which cleavage by mitochondrial processing peptidase (MPP) or mitochondrial rhomboid protease (Pcp1, C13E7.11, 1D784, PARL) occurs. Putative rhomboid proteases and predicted cleavage regions are indicated by question mark. S.c., Saccharomyces cerevisiae; S.p., Schizosaccharomyces pombe; C.e., Caenorhabditis elegans; H.s., Homo sapiens; MTS, mitochondrial targeting sequence. For OPA1 splice variant 8 was analyzed. (B) Immunoblotting with antibodies against Mgm1 of total yeast cell extracts from Δmgm1 strains (or Δpcp1Δmgm1 strain, respectively) expressing indicated Mgm1 version. Bands corresponding to l-Mgm1 and s-Mgm1 are indicated. Mgm1 versions: WT, wild-type; Δ1, lacking first hydrophobic segment (residues 91–111); Δ2, lacking second hydrophobic segment (residues 154–167); Δ1&Δ2, lacking both hydrophobic segments; G100D, G100K, respective point mutations; VVL, three residues (GGM) at position 100–102 were replaced by VVL. (C) Mitochondrial morphology of indicated strains was scored for at least 150 cells in three experiments. The amount of cells containing a mitochondrial tubular network is expressed as percentage of the control strain expressing Mgm1. SD is indicated by the errors bars. (D) Representative fluorescence (left) and phase contrast (right) images of indicated strains expressing mitochondrially targeted GFP. Bar, 5 μm.
Figure 2.
Figure 2.
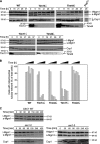
A functional protein import motor is essential for biogenesis of Mgm1 and mitochondrial morphology. (A) Down-regulation of essential components of mitochondrial preprotein translocases. Aliquots were withdrawn after indicated time periods of down-regulation and total yeast cell extracts were analyzed by immunoblotting with the indicated antibodies. Complete Ccp1 processing is shown as a control for Pcp1 activity. i, intermediate; m, mature. (B) Mitochondrial morphology of cells analyzed in A was determined (at least 150 cells for each time point). (C) Wild-type (SSC1 WT) and temperature-sensitive mtHsp70 mutants (ssc1-2, ssc1-3) were shifted from permissive (24°C) to nonpermissive temperature (37°C). Aliquots were withdrawn at the indicated time points and analyzed as in A. (D) Mitochondrial morphology of cells analyzed in C. The average of five experiments is shown. (E) Representative fluorescence (left) and phase contrast (right) images. Size differences of cells are due to different carbon sources used for down-regulation of import components and the temperature shift experiment of ssc1 mutants. Bar, 5 μm.
Figure 2.
Figure 2.
A functional protein import motor is essential for biogenesis of Mgm1 and mitochondrial morphology. (A) Down-regulation of essential components of mitochondrial preprotein translocases. Aliquots were withdrawn after indicated time periods of down-regulation and total yeast cell extracts were analyzed by immunoblotting with the indicated antibodies. Complete Ccp1 processing is shown as a control for Pcp1 activity. i, intermediate; m, mature. (B) Mitochondrial morphology of cells analyzed in A was determined (at least 150 cells for each time point). (C) Wild-type (SSC1 WT) and temperature-sensitive mtHsp70 mutants (ssc1-2, ssc1-3) were shifted from permissive (24°C) to nonpermissive temperature (37°C). Aliquots were withdrawn at the indicated time points and analyzed as in A. (D) Mitochondrial morphology of cells analyzed in C. The average of five experiments is shown. (E) Representative fluorescence (left) and phase contrast (right) images. Size differences of cells are due to different carbon sources used for down-regulation of import components and the temperature shift experiment of ssc1 mutants. Bar, 5 μm.
Figure 3.
Figure 3.
Mitochondrial morphology and formation of s-Mgm1 is ATP dependent. (A–C; left) Radiolabeled Mgm11-228–DHFR precursors were imported into isolated yeast mitochondria and treated with 50 μg/ml trypsin after import. p, precursor; lΔ2, l-Mgm1(Δ2)1-228–DHFR; L, 20% of radiolabeled precursor used per import reaction. (Right) The relative amount of s-Mgm11-228–DHFR as percentage of total Mgm11-228–DHFR was determined by densitometric quantification. (A) Indicated variants (compare with Fig. 1) of radiolabeled Mgm11-228–DHFR precursors were imported into yeast mitochondria. For VVL and Δ2 background intensity at the size corresponding to s-Mgm11-228–DHFR was quantified. (B) Mitochondria were depleted from ATP before import where indicated. (C) Mitochondria isolated from wild-type or ssc1-3 temperature-sensitive mutant were preincubated at the indicated temperature for 15 min before import. (A–C) Statistically highly significant deviations (P < 0.01) compared (A) to wild-type (n = 8), (B) to import without ATP depletion (n = 6), and (C) to import after preincubation at 24°C (n = 6) according to Wilcoxon test are indicated by **. (D) Analysis of the M28-82 strain (atp6) containing a mutation, which was mapped to the mitochondrially encoded ATP6 gene. Wild-type and mutant strain were grown on nonfermentable carbon source at 30°C and used for immunoblotting of total yeast cell extracts with antibodies against Mgm1 and Ccp1. (E) Mitochondrial morphology for cells analyzed in D (at least 150 cells in four experiments). SD is indicated by error bars. (F) Representative fluorescence (left) and phase contrast (right) images of the M28-82 strain stained with rhodamine B hexyl ester. Bar, 5 μm.
Figure 3.
Figure 3.
Mitochondrial morphology and formation of s-Mgm1 is ATP dependent. (A–C; left) Radiolabeled Mgm11-228–DHFR precursors were imported into isolated yeast mitochondria and treated with 50 μg/ml trypsin after import. p, precursor; lΔ2, l-Mgm1(Δ2)1-228–DHFR; L, 20% of radiolabeled precursor used per import reaction. (Right) The relative amount of s-Mgm11-228–DHFR as percentage of total Mgm11-228–DHFR was determined by densitometric quantification. (A) Indicated variants (compare with Fig. 1) of radiolabeled Mgm11-228–DHFR precursors were imported into yeast mitochondria. For VVL and Δ2 background intensity at the size corresponding to s-Mgm11-228–DHFR was quantified. (B) Mitochondria were depleted from ATP before import where indicated. (C) Mitochondria isolated from wild-type or ssc1-3 temperature-sensitive mutant were preincubated at the indicated temperature for 15 min before import. (A–C) Statistically highly significant deviations (P < 0.01) compared (A) to wild-type (n = 8), (B) to import without ATP depletion (n = 6), and (C) to import after preincubation at 24°C (n = 6) according to Wilcoxon test are indicated by **. (D) Analysis of the M28-82 strain (atp6) containing a mutation, which was mapped to the mitochondrially encoded ATP6 gene. Wild-type and mutant strain were grown on nonfermentable carbon source at 30°C and used for immunoblotting of total yeast cell extracts with antibodies against Mgm1 and Ccp1. (E) Mitochondrial morphology for cells analyzed in D (at least 150 cells in four experiments). SD is indicated by error bars. (F) Representative fluorescence (left) and phase contrast (right) images of the M28-82 strain stained with rhodamine B hexyl ester. Bar, 5 μm.
Figure 4.
Figure 4.
Model of alternative topogenesis of Mgm1. The TIM23 translocase containing all essential subunits such as Tim23, Tim17, Tim50, Tim14, Tim44, and Ssc1 is shown in transparent gray color. The first and second hydrophobic segments in Mgm1 are indicated by gray and dark gray boxes, respectively. Numbers describe the order of the topogenesis pathway for the generation of l-Mgm1 (1 and 2a) and s-Mgm1 (1, 2b, 3b, and 4b). Processing by Pcp1 only occurs when the cleavage site in the second segment reaches the inner membrane, which is dependent on matrix ATP and a functional import motor. IMS, intermembrane space; IM, inner membrane; ΔΨ, membrane potential; MPP, mitochondrial processing peptidase; pMgm1, precursor protein of Mgm1; l-Mgm1 and s-Mgm1, large and short isoform of Mgm1, respectively.

Similar articles

Cited by

References

    1. Alexander, C., M. Votruba, U.E. Pesch, D.L. Thiselton, S. Mayer, A. Moore, M. Rodriguez, U. Kellner, B. Leo-Kottler, G. Auburger, et al. 2000. OPA1, encoding a dynamin-related GTPase, is mutated in autosomal dominant optic atrophy linked to chromosome 3q28. Nat. Genet. 26:211–215. - PubMed
    1. Delettre, C., G. Lenaers, J.M. Griffoin, N. Gigarel, C. Lorenzo, P. Belenguer, L. Pelloquin, J. Grosgeorge, C. Turc-Carel, E. Perret, et al. 2000. Nuclear gene OPA1, encoding a mitochondrial dynamin-related protein, is mutated in dominant optic atrophy. Nat. Genet. 26:207–210. - PubMed
    1. Dimmer, K.S., S. Fritz, F. Fuchs, M. Messerschmitt, N. Weinbach, W. Neupert, and B. Westermann. 2002. Genetic basis of mitochondrial function and morphology in Saccharomyces cerevisiae. Mol. Biol. Cell. 13:847–853. - PMC - PubMed
    1. Esser, K., B. Tursun, M. Ingenhoven, G. Michaelis, and E. Pratje. 2002. A novel two-step mechanism for removal of a mitochondrial signal sequence involves the mAAA complex and the putative rhomboid protease pcp1. J. Mol. Biol. 323:835–843. - PubMed
    1. Foury, F., and A. Tzagoloff. 1976. Localization on mitochondrial DNA of mutations leading to a loss of rutamycin-sensitive adenosine triphosphatase. Eur. J. Biochem. 68:113–119. - PubMed

Publication types

MeSH terms