. 2004 Jul;15(7):3450-63.
doi: 10.1091/mbc.e03-11-0807. Epub 2004 Apr 16.

The transcriptional response to Raf activation is almost completely dependent on Mitogen-activated Protein Kinase Kinase activity and shows a major autocrine component

Affiliations

The transcriptional response to Raf activation is almost completely dependent on Mitogen-activated Protein Kinase Kinase activity and shows a major autocrine component

Almut Schulze et al. Mol Biol Cell. 2004 Jul.

Abstract

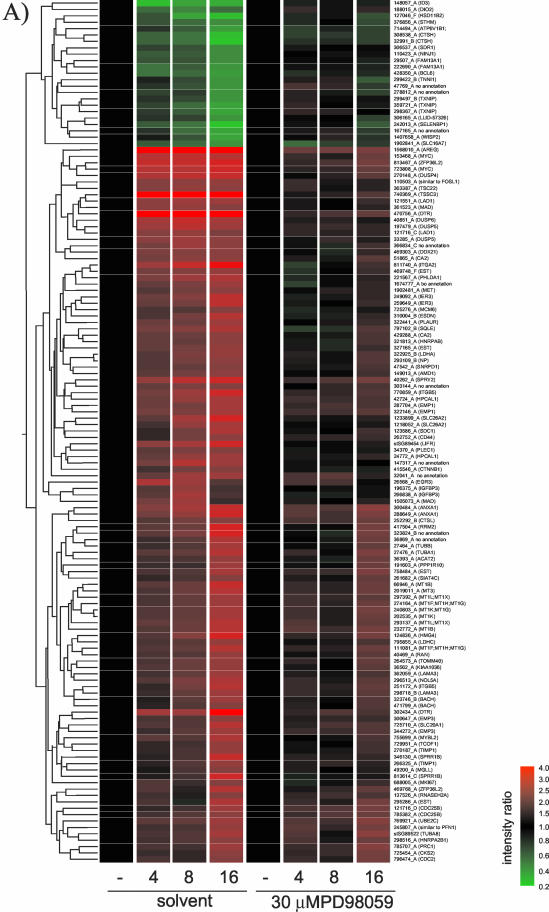
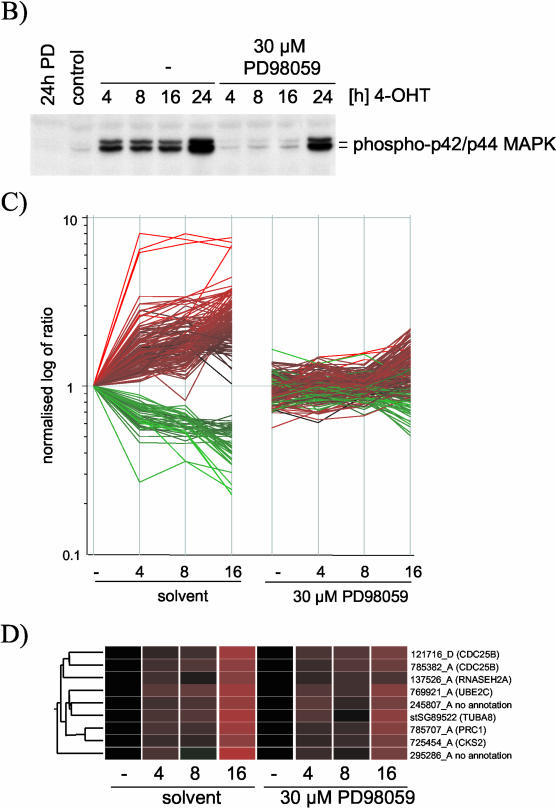
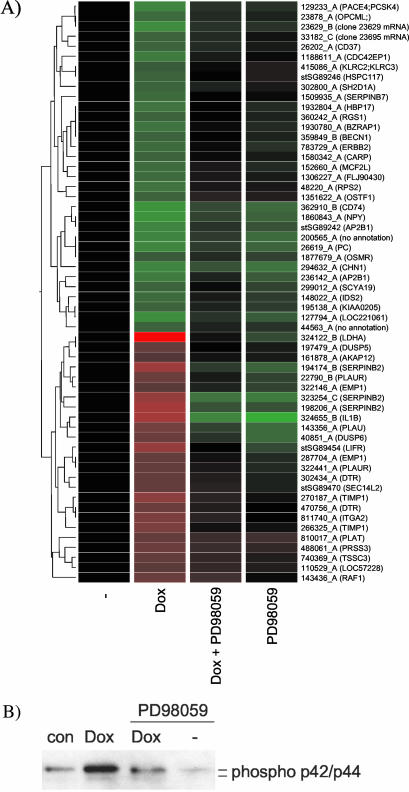
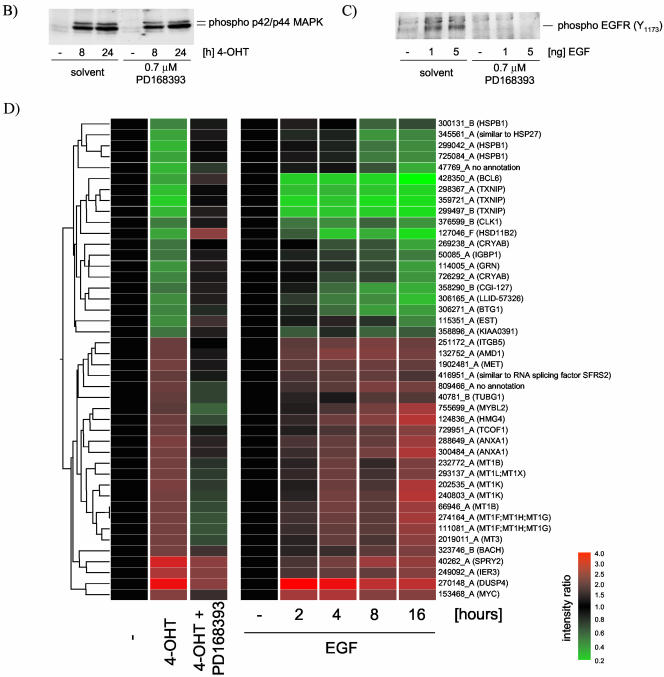
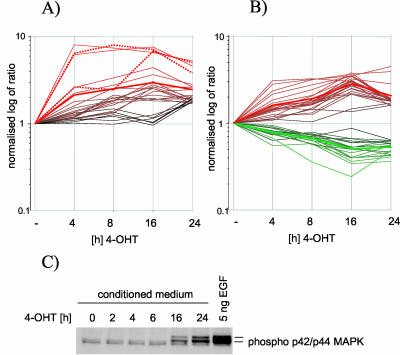
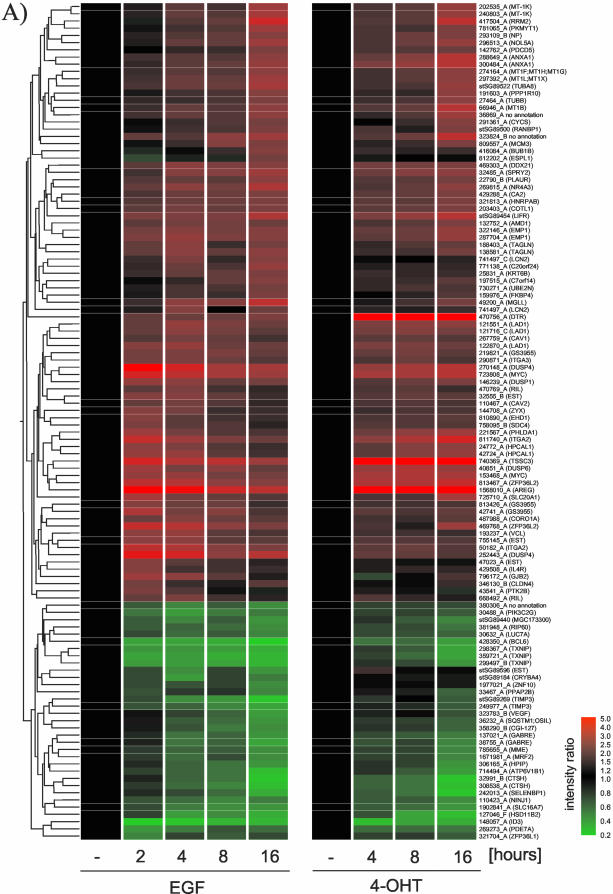
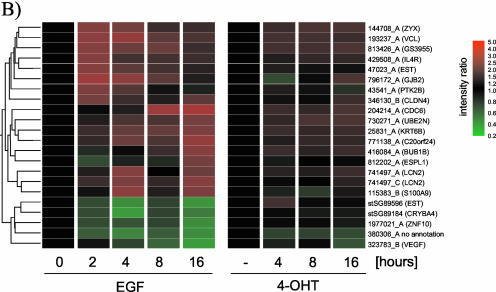
The Raf protein kinases are major effectors of Ras GTPases and key components of the transcriptional response to serum factors, acting at least in part through the extracellular signal-regulated kinase/mitogen-activated protein kinase pathway. It has recently been suggested that Raf also may trigger other as yet uncharacterized signaling pathways. Here, we have used cDNA microarrays to dissect changes in gene expression induced by activation of inducible c-Raf-1 constructs in human mammary epithelial and ovarian epithelial cells. The majority of Raf-induced transcriptional responses are shown to be blocked by pharmacological inhibition of the Raf substrate mitogen-activated protein kinase kinase, indicating that potential mitogen-activated protein kinase kinase-independent Raf signaling pathways have no significant influence on gene expression. In addition, we used epidermal growth factor receptor inhibitory drugs to address the contribution of autocrine signaling by Raf-induced EGF family proteins to the Raf transcriptional response. At least one-half of the transcription induced by Raf activation requires epidermal growth factor (EGF) receptor function The EGF receptor-independent component of the Raf transcriptional response is entirely up-regulation of gene expression, whereas the EGF receptor-dependent component is an equal mixture of up- and down-regulation. The use of transcriptional profiling in this way allows detailed analysis of the architecture of signaling pathways to be undertaken.


Figures

Figure 1.
Figure 1.
Changes in gene expression induced by ΔRaf-ER activation in MCF-10A cells are dependent on MEK activity. (A) MCF-10A ΔRaf-ER cells were treated with 100 nM 4-OHT or solvent (ethanol) for 4, 8, or 16 h in minimal medium in the presence or absence of 30 μM PD98059. Relative mRNA abundance was measured by comparative hybridization of experimental and control samples to human cDNA microarrays. Hybridizations were performed in quadruplicates with inverted Cy3/Cy5 labeling. Mean intensity ratios relative to the solvent treated control (-) for 135 probes that detected significant changes in gene expression upon Raf-ER activation were used to generate hierarchical clusters of genes with similar expression profiles. Probes are identified by their unique Sanger IDs as well as HUGO names of the corresponding gene (mapped to ENSEMBL). For a detailed description of the clones including GenBank and Unigene accession numbers, see Table 1 (supplementary data). EST, sequence maps to an ENSEMBL EST gene; no annotation, sequence does not map to any expressed sequence. (B) Phosphorylation of p42ERK2/p44ERK1 detected with a phospho-specific antibody by using cytoplasmic lysates from cells prepared in parallel to the experiment shown in A. To demonstrate decreased activity of PD98059 over time, a 24-h time point was included in this experiment. (C) Graphical representation of the data shown in Figure 1. The vertical axis shows the log of normalized intensity ratios for all Raf-responsive probes. The horizontal axis shows the time of treatment with 4-OHT in the presence or absence of PD98059. (D) Nine of the 135 Raf-regulated probes represented in 1A that do not show a significant difference in their expression in the presence or absence of PD98059. For a detailed description of the clones, see Table 1 (supplementary data).
Figure 1.
Figure 1.
Changes in gene expression induced by ΔRaf-ER activation in MCF-10A cells are dependent on MEK activity. (A) MCF-10A ΔRaf-ER cells were treated with 100 nM 4-OHT or solvent (ethanol) for 4, 8, or 16 h in minimal medium in the presence or absence of 30 μM PD98059. Relative mRNA abundance was measured by comparative hybridization of experimental and control samples to human cDNA microarrays. Hybridizations were performed in quadruplicates with inverted Cy3/Cy5 labeling. Mean intensity ratios relative to the solvent treated control (-) for 135 probes that detected significant changes in gene expression upon Raf-ER activation were used to generate hierarchical clusters of genes with similar expression profiles. Probes are identified by their unique Sanger IDs as well as HUGO names of the corresponding gene (mapped to ENSEMBL). For a detailed description of the clones including GenBank and Unigene accession numbers, see Table 1 (supplementary data). EST, sequence maps to an ENSEMBL EST gene; no annotation, sequence does not map to any expressed sequence. (B) Phosphorylation of p42ERK2/p44ERK1 detected with a phospho-specific antibody by using cytoplasmic lysates from cells prepared in parallel to the experiment shown in A. To demonstrate decreased activity of PD98059 over time, a 24-h time point was included in this experiment. (C) Graphical representation of the data shown in Figure 1. The vertical axis shows the log of normalized intensity ratios for all Raf-responsive probes. The horizontal axis shows the time of treatment with 4-OHT in the presence or absence of PD98059. (D) Nine of the 135 Raf-regulated probes represented in 1A that do not show a significant difference in their expression in the presence or absence of PD98059. For a detailed description of the clones, see Table 1 (supplementary data).
Figure 2.
Figure 2.
Changes in gene expression induced by induction of Raf1-CAAX expression in HOSE cells are dependent on MEK activity. (A) HOSE-TREX Raf1-CAAX cells were starved in medium containing 0.5% horse serum for 8 h and subsequently treated with 1 nM doxycycline (dox) for 16 h in the presence or absence of 50 μM PD98059. Relative mRNA abundance was measured by comparative hybridization of experimental and control samples from two independent experiments to human cDNA microarrays. Mean Intensity ratios relative to the solvent treated control (-) for 58 probes that show significant changes in gene expression upon Raf activation were used to generate hierarchical clusters of genes with similar expression profiles. For a detailed description of the genes, see Table 2 (supplementary data). (B) Phosphorylation of p42ERK2/p44ERK1 detected with a phospho-specific antibody by using cytoplasmic lysates from cells prepared in parallel to the experiment shown in A.
Figure 3.
Figure 3.
A large proportion of the transcriptional response to Raf activation is dependent on autocrine activation of the EGF receptor. (A) MCF-10A ΔRaf-ER cells were treated with 100 nM 4-OHT or solvent (control and 0 h) for 24 h in minimal medium in the presence (4-OHT + PD168393) or absence (4-OHT) of 0.7 μM PD168393 in minimal medium. In a parallel experiment, parental MCF-10A cells were grown in minimal medium for 8 h and subsequently treated with 20 ng/ml EGF for 2, 4, 8, or 16 h. Relative mRNA abundance was measured by comparative hybridization of experimental and control samples from two independent experiments to human cDNA microarrays. Mean Intensity ratios relative to the solvent treated control (-) for 108 probes that show significant changes in gene expression upon Raf-ER activation were used to generate hierarchical clusters of genes with similar expression profiles. Note that the results for probe 302434_A (DTR) are absent from the EGF induction data (gray bars). For a detailed description of the clones see Table 3 (supplementary data). (B) Time course of 4-OHT treatment in MCF-10A ΔRaf-ER cells in the presence or absence of PD16839. Phosphorylation of p42ERK2/p44ERK1 was detected using a phospho-specific antibody. (C) MCF-10A cells were treated with 0.7 μu PD 168393 or solvent for 24 h in minimal medium and subsequently stimulated with EGF. Phosphorylation of EGFR was detected using a phospho-specific antibody. (D) EGFR dependent Raf-responsive genes: 44 of the 108 Raf-regulated probes shown in A that show a significant difference in their response to Raf activation in the presence or absence of PD168393 (p < 0.05; Welch ANOVA). (E) EGFR independent Raf-responsive genes: 24 of the 108 Raf-responsive genes shown in A that show no significant difference in their response to Raf activation in the presence or absence of PD16839. Probes that show some difference (p < 0.5; Welch ANOVA) were selected and subtracted from all Raf-responsive probes. The remaining 24 probes were considered to show very similar expression levels between the two samples. Cluster 1 indicates a group of genes that shows up-regulation in response to Raf activation but no change in response to EGF treatment.
Figure 3.
Figure 3.
A large proportion of the transcriptional response to Raf activation is dependent on autocrine activation of the EGF receptor. (A) MCF-10A ΔRaf-ER cells were treated with 100 nM 4-OHT or solvent (control and 0 h) for 24 h in minimal medium in the presence (4-OHT + PD168393) or absence (4-OHT) of 0.7 μM PD168393 in minimal medium. In a parallel experiment, parental MCF-10A cells were grown in minimal medium for 8 h and subsequently treated with 20 ng/ml EGF for 2, 4, 8, or 16 h. Relative mRNA abundance was measured by comparative hybridization of experimental and control samples from two independent experiments to human cDNA microarrays. Mean Intensity ratios relative to the solvent treated control (-) for 108 probes that show significant changes in gene expression upon Raf-ER activation were used to generate hierarchical clusters of genes with similar expression profiles. Note that the results for probe 302434_A (DTR) are absent from the EGF induction data (gray bars). For a detailed description of the clones see Table 3 (supplementary data). (B) Time course of 4-OHT treatment in MCF-10A ΔRaf-ER cells in the presence or absence of PD16839. Phosphorylation of p42ERK2/p44ERK1 was detected using a phospho-specific antibody. (C) MCF-10A cells were treated with 0.7 μu PD 168393 or solvent for 24 h in minimal medium and subsequently stimulated with EGF. Phosphorylation of EGFR was detected using a phospho-specific antibody. (D) EGFR dependent Raf-responsive genes: 44 of the 108 Raf-regulated probes shown in A that show a significant difference in their response to Raf activation in the presence or absence of PD168393 (p < 0.05; Welch ANOVA). (E) EGFR independent Raf-responsive genes: 24 of the 108 Raf-responsive genes shown in A that show no significant difference in their response to Raf activation in the presence or absence of PD16839. Probes that show some difference (p < 0.5; Welch ANOVA) were selected and subtracted from all Raf-responsive probes. The remaining 24 probes were considered to show very similar expression levels between the two samples. Cluster 1 indicates a group of genes that shows up-regulation in response to Raf activation but no change in response to EGF treatment.
Figure 4.
Figure 4.
Differences in timing of the induction of EGFR dependent and independent genes by Raf. EGFR-dependent and -independent genes do not show a significantly different timing in their response to Raf activation. Graphical representation of the expression profiles of EGFR independent (A) and EGFR dependent genes (B) after 4, 8, 16, and 24 h of ΔRaf-ER activation. The vertical axis represents the log of normalized intensity ratios, whereas the horizontal axis shows time of treatment with 4-OHT. Bold red and green lines represent the average intensity ratio of all up- or down-regulated probes at the different time points. Expression profiles of two probes representing HB-EGF (DTR) are shown as dotted lines in A. (C) To detect the onset of secretion of soluble EGF-like growth factors into the medium, MCF-10A ΔRaf-ER cells were treated with 4-OHT in minimal medium for 2, 4, 26, or 24 h. The medium conditioned by these cells was used to induce EGFR activation in parental MCF-10A cells. Parental cells were lysed after 10 min of treatment with conditioned medium and analyzed for p42ERK2/p44ERK1 phosphorylation by using phospho-specific antibodies. MAP kinase phosphorylation in parental MCF-10A cells after stimulation with 5 ng/ml soluble EGF is shown as control.
Figure 5.
Figure 5.
The transcriptional response to Raf activation and EGF treatment are very similar. (A) Expression data from MCF-10A cells treated with soluble EGF (experiment described in Figure 3) and MCF-10A ΔRaf-ER cells treated with 4-OHT for the indicated times (experiment described in Figure 1) were compared. Mean intensity ratios of 116 probes that show significant changes in gene expression in response to EGF treatment (p > 0.05, Welch ANOVA) were used to create hierarchical clusters of genes with similar expression profiles. For a detailed description of the clones, see Table 4 (supplementary data). (B) Twenty-two of the 116 EGF-responsive probes do not show a response to Raf activation.
Figure 5.
Figure 5.
The transcriptional response to Raf activation and EGF treatment are very similar. (A) Expression data from MCF-10A cells treated with soluble EGF (experiment described in Figure 3) and MCF-10A ΔRaf-ER cells treated with 4-OHT for the indicated times (experiment described in Figure 1) were compared. Mean intensity ratios of 116 probes that show significant changes in gene expression in response to EGF treatment (p > 0.05, Welch ANOVA) were used to create hierarchical clusters of genes with similar expression profiles. For a detailed description of the clones, see Table 4 (supplementary data). (B) Twenty-two of the 116 EGF-responsive probes do not show a response to Raf activation.

Similar articles

Cited by

References

    1. Alessi, D.R., Cuenda, A., Cohen, P., Dudley, D.T., and Saltiel, A.R. (1995). PD 098059 is a specific inhibitor of the activation of mitogen-activated protein kinase kinase in vitro and in vivo. J. Biol. Chem. 270, 27489-27494. - PubMed
    1. Baumann, B., Weber, C.K., Troppmair, J., Whiteside, S., Israel, A., Rapp, U.R., and Wirth, T. (2000). Raf induces NF-kappaB by membrane shuttle kinase MEKK1, a signaling pathway critical for transformation. Proc. Natl. Acad. Sci. USA 97, 4615-4620. - PMC - PubMed
    1. Bonni, A., Brunet, A., West, A.E., Datta, S.R., Takasu, M.A., and Greenberg, M.E. (1999). Cell survival promoted by the Ras-MAPK signaling pathway by transcription-dependent and -independent mechanisms. Science 286, 1358-1362. - PubMed
    1. Bos, J.L. (1989). ras oncogenes in human cancer: a review. Cancer Res. 49, 4682-4689. - PubMed
    1. Bosch, E., Cherwinski, H., Peterson, D., and McMahon, M. (1997). Mutations of critical amino acids affect the biological and biochemical properties of oncogenic A-Raf and Raf-1. Oncogene 15, 1021-1033. - PubMed

MeSH terms

Substances