Defining a molecular atlas of the hippocampus using DNA microarrays and high-throughput in situ hybridization
- PMID: 15084669
- PMCID: PMC6729356
- DOI: 10.1523/JNEUROSCI.4710-03.2004
Defining a molecular atlas of the hippocampus using DNA microarrays and high-throughput in situ hybridization
Abstract
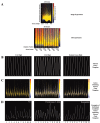
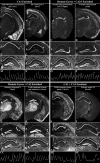
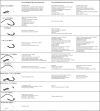
The hippocampus consists of a series of cytoarchitecturally discrete subregions that can be distinguished from one another on the basis of morphology, connectivity, and electrophysiological properties. To understand the molecular underpinnings for these differences, DNA microarrays were used to find genes predicted to be enriched in subregions CA1, CA3, and the dentate gyrus, and >100 of these genes were subsequently analyzed using in situ hybridization to obtain cellular-level localization of their transcripts. The most striking commonality among the resulting patterns of gene expression is the extent to which cytoarchitectural boundaries within the hippocampus are respected, although the complexity of these patterns could not have been predicted on the basis of the microarray data alone. Among those genes with expression that can be characterized as "restricted" to neurons in one or more subregions of the hippocampus are a number of signal transduction molecules, transcription factors, calcium-binding proteins, and carbohydrate-modifying enzymes. These results suggest that important determinants of the unique identities of adult hippocampal neurons are differential signal transduction, regulation of gene expression, calcium homeostasis, and the maintenance of a unique extracellular milieu. Furthermore, the extremely high correlation between microarray data and in situ expression demonstrates the great utility of using DNA microarrays to genetically profile discrete brain regions.
Figures


Similar articles
-
Transcriptional profiling reveals strict boundaries between hippocampal subregions.J Comp Neurol. 2001 Dec 17;441(3):187-96. doi: 10.1002/cne.1406. J Comp Neurol. 2001. PMID: 11745644
-
A molecular blueprint of gene expression in hippocampal subregions CA1, CA3, and DG is conserved in the brain of the common marmoset.Hippocampus. 2009 Aug;19(8):739-52. doi: 10.1002/hipo.20555. Hippocampus. 2009. PMID: 19156849
-
Redefining the boundaries of the hippocampal CA2 subfield in the mouse using gene expression and 3-dimensional reconstruction.J Comp Neurol. 2005 Apr 25;485(1):1-10. doi: 10.1002/cne.20426. J Comp Neurol. 2005. PMID: 15776443
-
Seizure-induced gene expression in area CA1 of the mouse hippocampus.Eur J Neurosci. 2001 Dec;14(12):2037-41. doi: 10.1046/j.0953-816x.2001.01818.x. Eur J Neurosci. 2001. PMID: 11860499
-
A behavioral assessment of hippocampal function based on a subregional analysis.Rev Neurosci. 2004;15(5):333-51. doi: 10.1515/revneuro.2004.15.5.333. Rev Neurosci. 2004. PMID: 15575490 Review.
Cited by
-
Structural diversity inside the mouse subiculum revealed by a new marker protein fibronectin 1.Anat Sci Int. 2024 Oct 4. doi: 10.1007/s12565-024-00803-4. Online ahead of print. Anat Sci Int. 2024. PMID: 39365413
-
RhoGEF Tiam2 Regulates Glutamatergic Synaptic Transmission in Hippocampal CA1 Pyramidal Neurons.eNeuro. 2024 Jul 19;11(7):ENEURO.0500-21.2024. doi: 10.1523/ENEURO.0500-21.2024. Print 2024 Jul. eNeuro. 2024. PMID: 38871458 Free PMC article.
-
Estimation of cAMP binding in hippocampus CA1 field by a fluorescent probe.Front Cell Dev Biol. 2023 Sep 29;11:1267956. doi: 10.3389/fcell.2023.1267956. eCollection 2023. Front Cell Dev Biol. 2023. PMID: 37842083 Free PMC article.
-
Hippocampal area CA2: interneuron disfunction during pathological states.Front Neural Circuits. 2023 Apr 27;17:1181032. doi: 10.3389/fncir.2023.1181032. eCollection 2023. Front Neural Circuits. 2023. PMID: 37180763 Free PMC article. Review.
-
Hippocampus: Molecular, Cellular, and Circuit Features in Anxiety.Neurosci Bull. 2023 Jun;39(6):1009-1026. doi: 10.1007/s12264-023-01020-1. Epub 2023 Jan 21. Neurosci Bull. 2023. PMID: 36680709 Free PMC article. Review.
References
-
- Akai F, Yanagihara T (1993) Identity of the dorsal hippocampal region most vulnerable to cerebral ischemia. Brain Res 603: 87–95. - PubMed
-
- Altman J, Das GD (1965) Autoradiographic and histological evidence of postnatal hippocampal neurogenesis in rats. J Comp Neurol 124: 319–335. - PubMed
-
- Amaral DG, Insausti R (1990) Hippocampal formation. In: The human nervous system (Paxinos G, ed), pp 711–755. New York: Academic.
Publication types
MeSH terms
Grants and funding
LinkOut - more resources
Full Text Sources
Other Literature Sources
Miscellaneous
