. 2004 Jul 1;381(Pt 1):231-9.
doi: 10.1042/BJ20031614.

Angiotensin II-induced ERK1/ERK2 activation and protein synthesis are redox-dependent in glomerular mesangial cells

Affiliations

Angiotensin II-induced ERK1/ERK2 activation and protein synthesis are redox-dependent in glomerular mesangial cells

Yves Gorin et al. Biochem J. .

Abstract

Angiotensin II (Ang II) stimulates hypertrophy of glomerular mesangial cells. The signalling mechanism by which Ang II exerts this effect is not precisely known. Downstream potential targets of Ang II are the extracellular-signal-regulated kinases 1 and 2 (ERK1/ERK2). We demonstrate that Ang II activates ERK1/ERK2 via the AT1 receptor. Arachidonic acid (AA) mimics the action of Ang II on ERK1/ERK2 and phospholipase A2 inhibitors blocked Ang II-induced ERK1/ERK2 activation. The antioxidant N-acetylcysteine as well as the NAD(P)H oxidase inhibitors diphenylene iodonium and phenylarsine oxide abolished both Ang II- and AA-induced ERK1/ERK2 activation. Moreover, dominant-negative Rac1 (N17Rac1) blocks activation of ERK1/ERK2 in response to Ang II and AA, whereas constitutively active Rac1 resulted in an increase in ERK1/ERK2 activity. Antisense oligonucleotides for Nox4 NAD(P)H oxidase significantly reduce activation of ERK1/ERK2 by Ang II and AA. We also show that protein synthesis in response to Ang II and AA is inhibited by N17Rac1 or MEK (mitogen-activated protein kinase/ERK kinase) inhibitor. These results demonstrate that Ang II stimulates ERK1/ERK2 by AA and Nox4-derived reactive oxygen species, suggesting that these molecules act as downstream signal transducers of Ang II in the signalling pathway linking the Ang II receptor AT1 to ERK1/ERK2 activation. This pathway involving AA, Rac1, Nox4, reactive oxygen species and ERK1/ERK2 may play an important role in Ang II-induced mesangial cell hypertrophy.


Figures

Figure 1
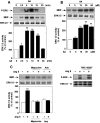
Figure 1. Effects of Ang II on ERK1/ERK2 and p38-MAPK activation in MCs
(A) Time course of ERK1/ERK2 activation by Ang II. Serum-deprived MCs were treated with 1 μM Ang II for the indicated time periods. ERK activation was assessed either using anti-phospho-specific ERK antibodies (top panel) or by immunocomplex kinase assay in ERK1/ERK2 immunoprecipitates with myelin basic protein (MBP) as substrate (second panel from the top). The third panel from the top shows the immunoblot analysis of cell lysates with ERK1/ERK2 antibody. (B) Dose–response of ERK1/ERK2 activation by Ang II. Cells were treated with various concentrations of Ang II (0.001–1 μM) for 5 min. (C) Ang II activates ERK1/ERK2 through the AT1 receptor. Ang II receptor antagonists losartan (10 μM, AT1 receptor specific) and PD123319 (10 μM, AT2 receptor specific) were added to the cultured medium for 30 min before exposure of the cells to 1 μM Ang II for an additional 15 min. In (B, C), ERK1/ERK2 immunoprecipitates were incubated with myelin basic protein and phosphorylation of the substrate was assayed. The top panels are representative images of myelin basic protein phosphorylation by Ang II. The middle panels show the immunoblot analysis of cell lysates with ERK1/ERK2 antibody. In (AC), each histogram of the bottom panel represents the ratio of the radioactivity incorporated into the phosphorylated myelin basic protein quantified by PhosphorImager analysis divided by the densitometric measurement of ERK1/ERK2 band. Results are expressed as percentage of control where the ratio in the untreated cells was defined as 100%. Values are the means±S.E.M. for three independent experiments. *P<0.05; **P<0.01 versus control.
Figure 2
Figure 2. Effects of AA on ERK1/ERK2 activation in MCs
(A) Time-dependent activation of ERK1/ERK2 by AA. Serum-deprived MCs were treated with 30 μM AA for the time periods indicated. ERK activation was assessed either by using anti-phospho-specific ERK antibodies (top panel) or by immunocomplex kinase assay in ERK1/ERK2 immunoprecipitates with myelin basic protein (MBP) as substrate (second panel from the top). The third panel from the top shows the immunoblot analysis of cell lysates with ERK1/ERK2 antibody. (B) Dose–response of ERK1/ERK2 activation by AA. Cells were treated with various concentrations of AA (5–30 μM) for 15 min. (C) Left panel: effect of PLA2 inhibitors on Ang II-induced ERK1/ERK2 activation. Serum-deprived MCs were preincubated with mepacrine (500 μM, 5 min) or aristolochic acid (50 μM, 30 min) followed by 1 μM Ang II for 10 min. Right panel: effect of DAG lipase inhibitor on Ang II-induced ERK1/ERK2 activation. MCs were preincubated with RHC-80267 (50 μM, 30 min) followed by 1 μM Ang II for 10 min. ERK activation was assessed using anti-phospho-specific ERK antibodies (top panel). In (B, C), the top panels are representative images of myelin basic protein phosphorylation by AA. The middle panel in (B) and bottom panel in (C) respectively show the immunoblot analysis of cell lysates with ERK1/ERK2 antibody. In (AC), each histogram of the lower panel represents the ratio of the radioactivity incorporated into the phosphorylated myelin basic protein quantified by PhosphorImager analysis divided by the densitometric measurement of ERK1/ERK2 band. Results are expressed as percentage of control, where the ratio in the untreated cells was defined as 100%. Values are the means±S.E.M. for three independent experiments. *P<0.05; **P<0.01 versus control.
Figure 3
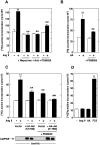
Figure 3. Roles of ERK1/ERK2 and PLA2 in Ang II-induced hypertrophy
Serum-deprived MCs were treated with (filled bars) and without (open bars) 1 μM Ang II (A) or 30 μM AA (B) for 48 h in the presence or absence of the indicated inhibitors (mepacrine, 500 μM for 5 min; Aris (aristolochic acid), 50 μM for 30 min; PD98059, 50 μM for 1 h). Protein synthesis was measured by [3H]leucine incorporation as described in the Experimental section. Values are the means±S.E.M. for three independent experiments. **P<0.01 compared with control; ##P<0.01 compared with treatment with Ang II or AA alone. (C) MCs were transfected with HA-tagged inactive Akt/PKB mutant [HA-Akt (K179M)] or vector as control in the presence or absence of PD98059 (50 μM, 1h) and treated with (filled bars) or without (open bars) 1 μM Ang II for 48 h. Protein synthesis was measured by [3H]leucine incorporation as described in the Experimental section. The lower panel shows immunoblot of cells transfected with vector or the dominant negative form of Akt/PKB using anti-HA antibody. Values are the means±S.E.M. for three independent experiments. **P<0.01 compared with control; ##P<0.01 compared with treatment with Ang II+vector; @@P<0.01 compared with Ang II+HA-Akt (K179M). (D) Serum-deprived MCs were treated with 1 μM Ang II, 30 μM AA or 10% FCS for 48 h and DNA synthesis was measured by [3H]thymidine incorporation as described in the Experimental section. Values are the means±S.E.M. for three independent experiments. **P<0.01 compared with control.
Figure 4
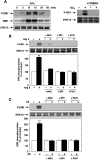
Figure 4. Role of ROS in ERK1/ERK2 activation by Ang II and AA
(A) Left panel: time course of ERK1/ERK2 activation by H2O2. Serum-deprived MCs were treated with 200 μM H2O2 for the time periods indicated. ERK activation was measured either by assessing ERK phosphorylation using phospho-specific anti-ERK antibody (top panel) or by immunocomplex kinase assay in ERK1/ERK2 immunoprecipitates using myelin basic protein as substrate (middle panel). The bottom panel shows the immunoblot analysis of cell lysates with ERK1/ERK2 antibody. Right panel: effect of MEK inhibitor on H2O2-induced ERK1/ERK2 activation. MCs were preincubated with PD98059 (50 μM, 1 h) followed by Ang II for 10 min. ERK activation was measured by assessing ERK phosphorylation using phospho-specific anti-ERK antibody (top panel). (B, C) Role of ROS in ERK1/ERK2 activation by Ang II and AA. Serum-deprived MCs were preincubated with or without 20 mM NAC, 10 μM DPI or 100 μM PAO for 30 min before treatment with 1 μM Ang II (B) or 30 μM AA (C) for 10 min. ERK activity was assessed using anti-phospho-specific ERK antibodies (top panels). The middle panels show the immunoblot analysis of cell lysates with ERK1/ERK2 antibody. In the lower panels, each histogram represents the ratio of the densitometric measurement of phosphorylated ERK band divided by the densitometric measurement of total ERK1/ERK2 band. Results are expressed as percentage of control where the ratio in the untreated cells was defined as 100%. Values are the means±S.E.M. for three independent experiments. **P<0.01 versus control.
Figure 5
Figure 5. Role of Rac1 in ERK1/ERK2 activation by Ang II and AA
(A) MCs were transiently transfected with Myc-tagged dominant-negative mutant Myc-N17Rac1 (N17) or vector as control and treated with or without 1 μM Ang II or 30 μM AA for 10 min. (B) MCs untreated or treated with NAC (20 mM) for 1h were transfected with constitutively active mutant Myc-L61Rac1 (L61) or vector as control without the addition of Ang II or AA. In (A, B), ERK1/ERK2 immunoprecipitates were incubated with myelin basic protein (MBP) and phosphorylation of the substrate was assayed. The second panel from the top is a representative image of myelin basic protein phosphorylation. The third panel from the top shows the immunoblot analysis of cell lysates with ERK1/ERK2 antibody. The bottom panel shows the immunoblot analysis of cell lysates using anti-Myc antibody to demonstrate mutant Rac1 expression. Each histogram represents the ratio of the radioactivity incorporated into the phosphorylated myelin basic protein quantified by PhosphorImager analysis divided by the densitometric measurement of ERK1/ERK2 band. Results are expressed as percentage of control where the ratio in the untreated cells was defined as 100%. Values are the means±S.E.M. for three independent experiments. **P<0.01 versus control.
Figure 6
Figure 6. Role of Nox4 in ERK1/ERK2 activation by Ang II and AA
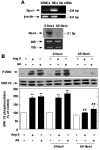
(A) Top panel: RT–PCR analysis showing that Nox4 mRNA is highly expressed in MCs. VSMCs were used as a positive control. Bottom panel, Northern-blot analysis showing that transfection by electroporation of AS Nox4 (1 μM), but not S Nox4 (1 μM), decreased mRNA expression of Nox4. Total RNA (10 μg) from rat MCs was hybridized with Nox4 cDNA. The lower panel shows the ethidium bromide staining of the same blot. (B) MCs were transfected with S Nox4 (1 μM) or AS Nox4 (1 μM) and treated with 1 μM Ang II or 30 μM AA for 5 min. ERK activation was assessed by using anti-phospho-specific ERK antibodies (top panel). The middle panel from the top shows the immunoblot analysis of cell lysates with ERK1/ERK2 antibody. Each histogram of the bottom panel represents the ratio of the densitometric analysis of ERK1/ERK2 phosphorylation divided by the densitometric measurement of ERK1/ERK2 band. Values are the means±S.E.M. for three independent experiments. **P<0.01 versus control; ##P<0.01 versus Ang II or AA.
Figure 7
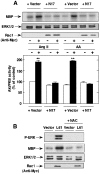
Figure 7. Role of Rac1 in Ang II- and AA-induced protein synthesis in MCs
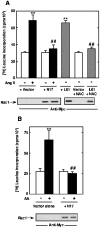
MCs were transfected with Myc-tagged dominant-negative mutant of Rac1, Myc-N17Rac1 (N17) or vector as control and treated with (filled bars) or without (open bars) 1 μM Ang II (A) or 30 μM AA (B) for 48 h. MCs were also transfected by a Myc-tagged constitutively active form of Rac1, Myc-L61Rac1 (L61), without the addition of Ang II or AA in the presence or absence of 20 mM NAC (A). [3H]Leucine incorporation was then assayed as described in the Experimental section. The bottom panels show immunoblots of cells transfected with empty vector, N17Rac1 or L61Rac1 using anti-Myc antibody to demonstrate mutant Rac1 expression. Values are the means±S.E.M. for three independent experiments. **P<0.01 compared with control; ##P<0.01 compared with treatment with Ang II or AA alone.
Figure 8
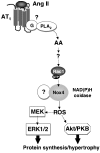
Figure 8. Proposed model of MC protein synthesis and hypertrophy stimulation by Ang II

Similar articles

Cited by

References

    1. Ardaillou R., Chansel D., Chatziantoniou C., Dussaule J. C. Mesangial AT1 receptors: expression, signaling, and regulation. J. Am. Soc. Nephrol. 1999;10:S40–S46. - PubMed
    1. Gorin Y., Kim N.-H., Feliers D., Bhandari B., Ghosh Choudhury G., Abboud H. E. Angiotensin II activates Akt/protein kinase B by an arachidonic acid/redox-dependent pathway and independent of phosphoinositide 3-kinase. FASEB J. 2001;15:1909–1920. - PubMed
    1. Schlondorff D., DeCandido S., Satriano J. A. Angiotensin II stimulates phospholipases C and A2 in cultured rat mesangial cells. Am. J. Physiol. 1987;253:C113–C120. - PubMed
    1. Alexander L. D., Cui X. L., Falck J. R., Douglas J. G. Arachidonic acid directly activates members of the mitogen-activated protein kinase superfamily in rabbit proximal tubule cells. Kidney Int. 2001;59:2039–2053. - PubMed
    1. Cui X. L., Douglas J. G. Arachidonic acid activates c-jun N-terminal kinase through NADPH oxidase in rabbit proximal tubular epithelial cells. Proc. Natl. Acad. Sci. U.S.A. 1997;94:3771–3776. - PMC - PubMed

Publication types

MeSH terms