Microarray expression analyses of Arabidopsis guard cells and isolation of a recessive abscisic acid hypersensitive protein phosphatase 2C mutant
- PMID: 14973164
- PMCID: PMC385275
- DOI: 10.1105/tpc.019000
Microarray expression analyses of Arabidopsis guard cells and isolation of a recessive abscisic acid hypersensitive protein phosphatase 2C mutant
Erratum in
- Plant Cell. 2005 Apr;17(4):1330-3
Abstract
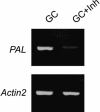
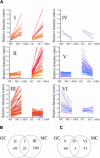
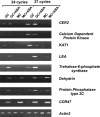
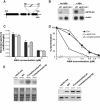
Oligomer-based DNA Affymetrix GeneChips representing about one-third of Arabidopsis (Arabidopsis thaliana) genes were used to profile global gene expression in a single cell type, guard cells, identifying 1309 guard cell-expressed genes. Highly pure preparations of guard cells and mesophyll cells were isolated in the presence of transcription inhibitors that prevented induction of stress-inducible genes during cell isolation procedures. Guard cell expression profiles were compared with those of mesophyll cells, resulting in identification of 64 transcripts expressed preferentially in guard cells. Many large gene families and gene duplications are known to exist in the Arabidopsis genome, giving rise to redundancies that greatly hamper conventional genetic and functional genomic analyses. The presented genomic scale analysis identifies redundant expression of specific isoforms belonging to large gene families at the single cell level, which provides a powerful tool for functional genomic characterization of the many signaling pathways that function in guard cells. Reverse transcription-PCR of 29 genes confirmed the reliability of GeneChip results. Statistical analyses of promoter regions of abscisic acid (ABA)-regulated genes reveal an overrepresented ABA responsive motif, which is the known ABA response element. Interestingly, expression profiling reveals ABA modulation of many known guard cell ABA signaling components at the transcript level. We further identified a highly ABA-induced protein phosphatase 2C transcript, AtP2C-HA, in guard cells. A T-DNA disruption mutation in AtP2C-HA confers ABA-hypersensitive regulation of stomatal closing and seed germination. The presented data provide a basis for cell type-specific genomic scale analyses of gene function.
Figures


Similar articles
-
Common and unique elements of the ABA-regulated transcriptome of Arabidopsis guard cells.BMC Genomics. 2011 May 9;12:216. doi: 10.1186/1471-2164-12-216. BMC Genomics. 2011. PMID: 21554708 Free PMC article.
-
The coronatine-insensitive 1 mutation reveals the hormonal signaling interaction between abscisic acid and methyl jasmonate in Arabidopsis guard cells. Specific impairment of ion channel activation and second messenger production.Plant Physiol. 2007 Mar;143(3):1398-407. doi: 10.1104/pp.106.091298. Epub 2007 Jan 12. Plant Physiol. 2007. PMID: 17220365 Free PMC article.
-
Disruption of a guard cell-expressed protein phosphatase 2A regulatory subunit, RCN1, confers abscisic acid insensitivity in Arabidopsis.Plant Cell. 2002 Nov;14(11):2849-61. doi: 10.1105/tpc.003335. Plant Cell. 2002. PMID: 12417706 Free PMC article.
-
The genes ABI1 and ABI2 are involved in abscisic acid- and drought-inducible expression of the Daucus carota L. Dc3 promoter in guard cells of transgenic Arabidopsis thaliana (L.) Heynh.Planta. 2000 May;210(6):875-83. doi: 10.1007/s004250050692. Planta. 2000. PMID: 10872217
-
Transcriptional Regulation of Protein Phosphatase 2C Genes to Modulate Abscisic Acid Signaling.Int J Mol Sci. 2020 Dec 14;21(24):9517. doi: 10.3390/ijms21249517. Int J Mol Sci. 2020. PMID: 33327661 Free PMC article. Review.
Cited by
-
Technologies for systems-level analysis of specific cell types in plants.Plant Sci. 2012 Dec;197:21-29. doi: 10.1016/j.plantsci.2012.08.012. Epub 2012 Aug 30. Plant Sci. 2012. PMID: 23116668 Free PMC article. Review.
-
The guard cell metabolome: functions in stomatal movement and global food security.Front Plant Sci. 2015 May 19;6:334. doi: 10.3389/fpls.2015.00334. eCollection 2015. Front Plant Sci. 2015. PMID: 26042131 Free PMC article. Review.
-
Plant senescence and crop productivity.Plant Mol Biol. 2013 Aug;82(6):603-22. doi: 10.1007/s11103-013-0013-8. Epub 2013 Jan 25. Plant Mol Biol. 2013. PMID: 23354836 Review.
-
Carbonic anhydrases are upstream regulators of CO2-controlled stomatal movements in guard cells.Nat Cell Biol. 2010 Jan;12(1):87-93; sup pp 1-18. doi: 10.1038/ncb2009. Epub 2009 Dec 13. Nat Cell Biol. 2010. PMID: 20010812 Free PMC article.
-
Update on plant ionomics.Plant Physiol. 2004 Sep;136(1):2451-6. doi: 10.1104/pp.104.047753. Plant Physiol. 2004. PMID: 15375201 Free PMC article. Review. No abstract available.
References
-
- Allen, G.J., Chu, S.P., Harrington, C.L., Schumacher, K., Hoffmann, T., Tang, Y.Y., Grill, E., and Schroeder, J.I. (2001). A defined range of guard cell calcium oscillation parameters encodes stomatal movements. Nature 411, 1053–1057. - PubMed
Publication types
MeSH terms
Substances
Grants and funding
LinkOut - more resources
Full Text Sources
Other Literature Sources
Molecular Biology Databases

