

doi: 10.1186/gb-2004-5-2-r11.
Epub 2004 Jan 16.
Predicting specificity in bZIP coiled-coil protein interactions
Affiliations
- PMID: 14759261
- PMCID: PMC395749
- DOI: 10.1186/gb-2004-5-2-r11
Item in Clipboard
Predicting specificity in bZIP coiled-coil protein interactions
Genome Biol.
2004.
Abstract
We present a method for predicting protein-protein interactions mediated by the coiled-coil motif. When tested on interactions between nearly all human and yeast bZIP proteins, our method identifies 70% of strong interactions while maintaining that 92% of predictions are correct. Furthermore, cross-validation testing shows that including the bZIP experimental data significantly improves performance. Our method can be used to predict bZIP interactions in other genomes and is a promising approach for predicting coiled-coil interactions more generally.
Figures
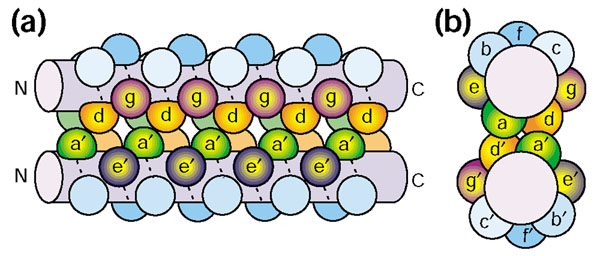
Cartoon of a parallel two-stranded coiled coil. (a) Side view and (b) top view. The interface between the α-helices in a coiled-coil structure is formed by residues at the core positions a, d, e and g. Positions in the two helices are distinguished by the prime notation; for example, a and a' are analogous positions in the two helices. N, amino terminus; C, carboxy terminus.
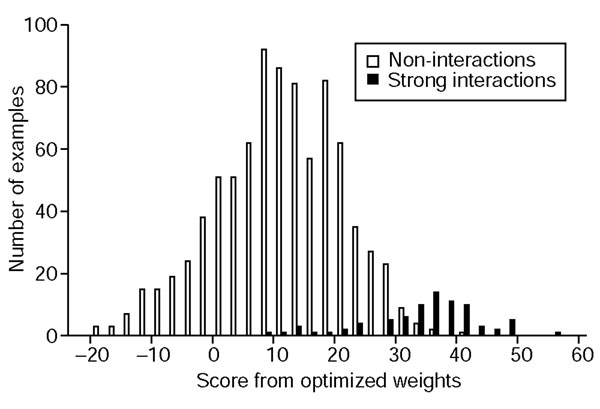
Histogram of scores using base-optimized weights. Non-interactions are shown in white and strong interactions are shown in black. Bins are of size 2.5.
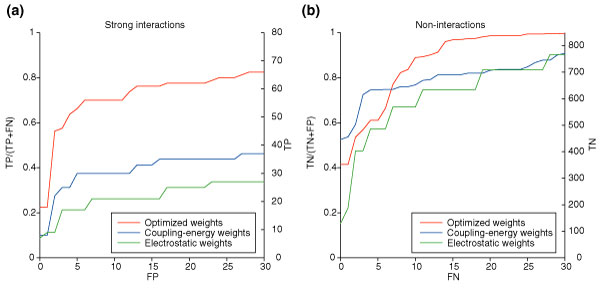
Prediction of strong interactions and non-interactions. Predictions are shown in red for the base-optimized weights, in blue for the coupling-energy weights, and in green for the simple electrostatic weights. (a) The fraction of strong coiled-coil interactions correctly identified as interactions (TP/(TP+FN)) as a function of the number of non-interactions incorrectly identified as interactions (FP). The second y-axis shows the number of strong coiled-coil interactions (TP). (b) The fraction of non-interactions correctly identified (TN/(TN+FP)), as a function of the number of strong interactions incorrectly identified as non-interactions (FN). The second y-axis shows the number of non-interactions (TN).
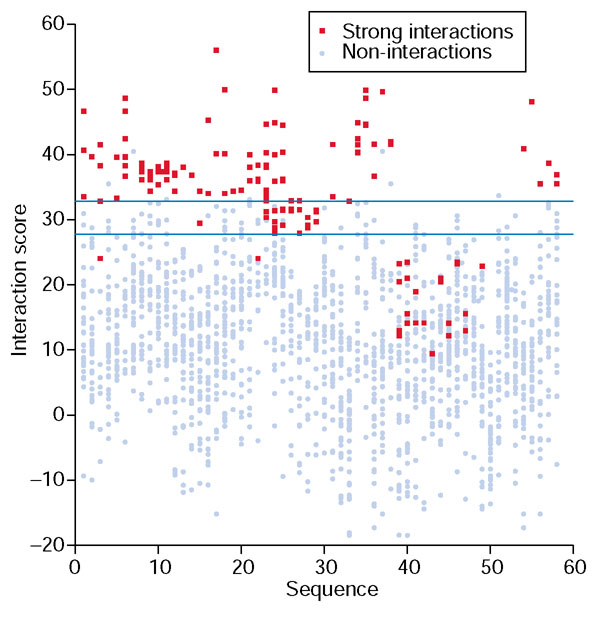
Interaction scores for each protein. Each column shows the interaction scores using the base-optimized weights for one sequence's strong interactions, shown in red, and non-interactions, shown in blue. The 58 sequences are grouped by similarity, and ordered as in Table 1 of Additional data file 1. The blue horizontal lines mark off high-confidence predictions of interactions (more than 32.8) and non-interactions (less than 27.8). Note that all heterodimer interactions appear twice on the graph.
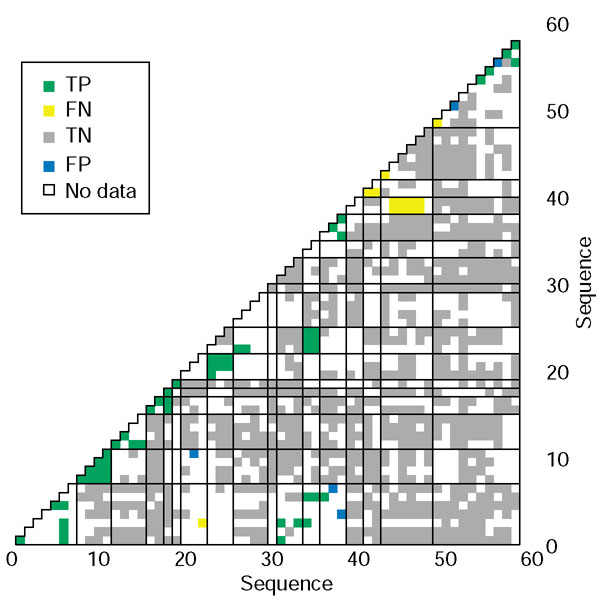
Full grid depiction of high-confidence predictions. Correct predictions are colored green (TP) or grey (TN) whereas incorrect predictions are colored yellow (FN) or blue (FP). White boxes represent pairs of sequences that are not classified as strong interactions or non-interactions. A point is 'positive' if its score using the base-optimized weights is greater than 32.8. A point is 'negative' if its score is lower than 27.8. Strong interactions and non-interactions are as defined in Methods. The sequences are grouped by similarity, and are numbered as in Table 1 of Additional data file 1. The families, separated by the gridlines, are ordered as follows: C/EBP, sequences 1-7; CREB, 8-11; OASIS, 12-15; ATF-6, 16-17; XBP, 18; E4BP4, 19; ATF-2, 20-22; JUN, 23-25; FOS, 26-29; ATF-3, 30; ATF-4, 31-33; B-ATF, 34-35; PAR, 36-38; smMAF, 39-40; lgMAF, 41-42; CNC, 43-48; and YEAST, 49-58.
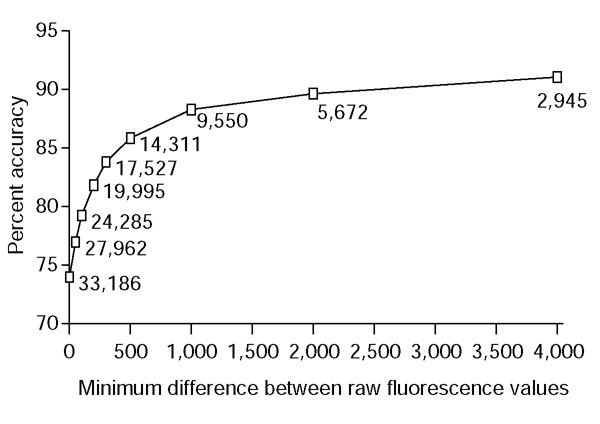
Accuracy in predicting relative strengths of interactions. Percent of comparisons correct using base-optimized weights, as a function of separation of raw fluorescence values. Labels on points show the number of comparisons with consistent experimental data and the given level of separation.
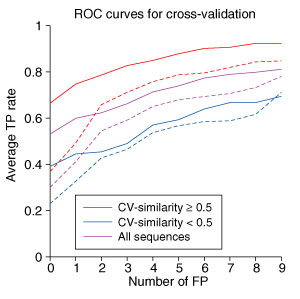
Cross-validation testing. The average fraction of correctly identified coiled-coil interactions as a function of the number of FP. Solid lines give averages computed using the appropriate cross-validation weights, and dotted lines give averages computed using the base-optimized weights. The TP rates shown were averaged over all human bZIP sequences, shown in purple, over human bZIP sequences with CV-similarity equal to or greater than 50%, shown in red, and over human bZIP sequences with CV-similarity less than 50%, shown in blue.
Similar articles
-
Structural basis for the diversity of DNA recognition by bZIP transcription factors.Nat Struct Biol. 2000 Oct;7(10):889-93. doi: 10.1038/82822. Nat Struct Biol. 2000. PMID: 11017199
-
Protein-directed DNA structure II. Raman spectroscopy of a leucine zipper bZIP complex.Biochemistry. 2000 Jan 25;39(3):548-56. doi: 10.1021/bi990053x. Biochemistry. 2000. PMID: 10642179
-
Comprehensive identification of human bZIP interactions with coiled-coil arrays.Science. 2003 Jun 27;300(5628):2097-101. doi: 10.1126/science.1084648. Epub 2003 Jun 12. Science. 2003. PMID: 12805554
-
Pharmacological interference with protein-protein interactions mediated by coiled-coil motifs.Handb Exp Pharmacol. 2008;(186):461-82. doi: 10.1007/978-3-540-72843-6_19. Handb Exp Pharmacol. 2008. PMID: 18491064 Review.
-
Interactions of coiled coils in transcription factors: where is the specificity?Curr Opin Genet Dev. 1993 Apr;3(2):278-85. doi: 10.1016/0959-437x(93)90035-n. Curr Opin Genet Dev. 1993. PMID: 8504253 Review.
Cited by
-
Combinatorial control of Arabidopsis proline dehydrogenase transcription by specific heterodimerisation of bZIP transcription factors.EMBO J. 2006 Jul 12;25(13):3133-43. doi: 10.1038/sj.emboj.7601206. Epub 2006 Jun 29. EMBO J. 2006. PMID: 16810321 Free PMC article.
-
Alpha-helical peptide assemblies giving new function to designed structures.Prog Mol Biol Transl Sci. 2011;103:231-75. doi: 10.1016/B978-0-12-415906-8.00001-7. Prog Mol Biol Transl Sci. 2011. PMID: 21999998 Free PMC article. Review.
-
Designing specific protein-protein interactions using computation, experimental library screening, or integrated methods.Protein Sci. 2012 Jul;21(7):949-63. doi: 10.1002/pro.2096. Epub 2012 Jun 8. Protein Sci. 2012. PMID: 22593041 Free PMC article. Review.
-
The genetic architecture of protein interaction affinity and specificity.Nat Commun. 2024 Oct 14;15(1):8868. doi: 10.1038/s41467-024-53195-4. Nat Commun. 2024. PMID: 39402041 Free PMC article.
-
A conserved leucine zipper-like motif accounts for strong tetramerization capabilities of SEPALLATA-like MADS-domain transcription factors.J Exp Bot. 2018 Apr 9;69(8):1943-1954. doi: 10.1093/jxb/ery063. J Exp Bot. 2018. PMID: 29474620 Free PMC article.
References
Publication types
MeSH terms
Substances
LinkOut - more resources
Full Text Sources
Other Literature Sources
