

Differential expression of thromboxane synthase in prostate carcinoma: role in tumor cell motility
- PMID: 14742249
- PMCID: PMC1602253
- DOI: 10.1016/S0002-9440(10)63133-1
Differential expression of thromboxane synthase in prostate carcinoma: role in tumor cell motility
Abstract
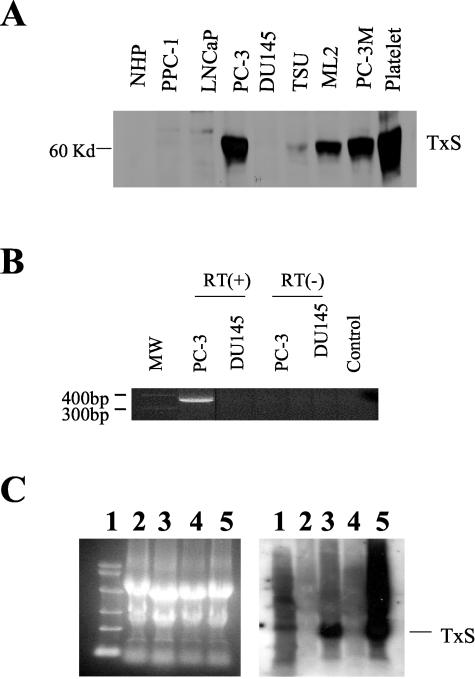
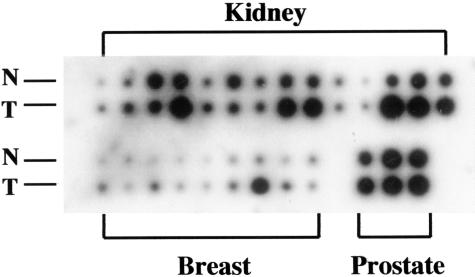
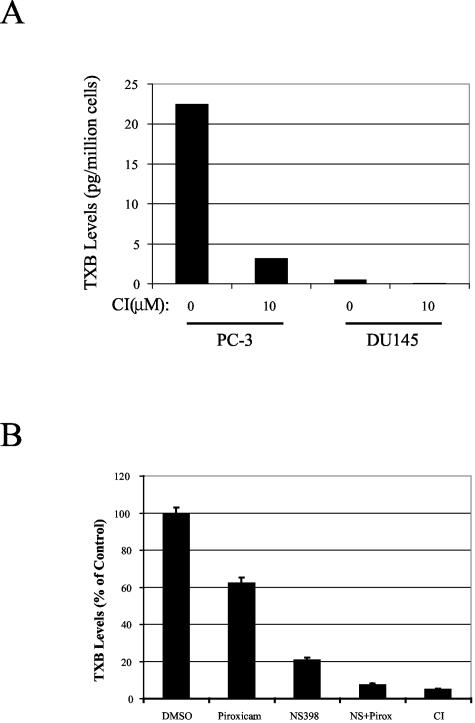
Arachidonic acid metabolism through cyclooxygenase, lipoxygenase, or P-450 epoxygenase pathways can generate a variety of eicosanoids. Thromboxane synthase (TxS) metabolizes the cyclooxygenase product, prostanglandin H(2), into thromboxane A(2) (TXA(2)), which can cause vessel constriction, platelet activation, and aggregation. Here we demonstrate that human prostate cancer (PCa) cells express enzymatically active TxS and that this enzyme is involved in cell motility. In human PCa cell lines, PC-3, PC-3M, and ML-2 cells expressed higher levels of TxS than normal prostate epithelial cells or other established PCa cell lines such as DU145, LNCaP, or PPC-1. We cloned and sequenced the full-length TxS cDNA from PC-3 cells and found two changes in the amino acid residues. Immunohistochemical analysis of tumor specimens revealed that expression of TxS is weak or absent in normal differentiated luminal, or secretory cells, significantly elevated in less differentiated or advanced prostate tumors, and markedly increased in tumors with perineural invasion. TxS expressed in PC-3 cells was enzymatically active and susceptible to carboxyheptal imidazole, an inhibitor of TxS. The biosynthesis of TXA(2) in PC-3 cells was dependent on COX-2, and to a lesser extent, COX-1. Treatment of PC-3 cells with a COX-1 selective inhibitor, piroxicam, reduced TXA(2) synthesis by approximately 40%, while the COX-2 specific inhibitor NS398 reduced TXA(2) production by approximately 80%. Inhibition of TxS activity or blockade of TXA(2) function reduced PC-3 cell migration on fibronectin, while having minimal effects on cell cycle progression or survival. Finally, increased expression of TxS in DU145 cells increased cell motility. Our data suggest that human PCa cells express TxS and that this enzyme may contribute to PCa progression through modulating cell motility.
Figures


Similar articles
-
Inhibitors of prostaglandin synthesis inhibit human prostate tumor cell invasiveness and reduce the release of matrix metalloproteinases.Cancer Res. 2000 Aug 15;60(16):4629-37. Cancer Res. 2000. PMID: 10969817
-
Differential expression of cyclooxygenase-2 and its regulation by tumor necrosis factor-alpha in normal and malignant prostate cells.Cancer Res. 2001 Mar 15;61(6):2720-6. Cancer Res. 2001. PMID: 11289153
-
Activation of the thromboxane A2 pathway in human prostate cancer correlates with tumor Gleason score and pathologic stage.Eur Urol. 2006 Nov;50(5):1021-31; discussion 1031. doi: 10.1016/j.eururo.2006.01.036. Epub 2006 Feb 23. Eur Urol. 2006. PMID: 16522350
-
The role of cyclooxygenase-2 in prostate cancer.Urology. 2001 Aug;58(2 Suppl 1):127-31. doi: 10.1016/s0090-4295(01)01255-9. Urology. 2001. PMID: 11502467 Review.
-
The thromboxane synthase and receptor signaling pathway in cancer: an emerging paradigm in cancer progression and metastasis.Cancer Metastasis Rev. 2011 Dec;30(3-4):397-408. doi: 10.1007/s10555-011-9297-9. Cancer Metastasis Rev. 2011. PMID: 22037941 Free PMC article. Review.
Cited by
-
Prostaglandin Pathways: Opportunities for Cancer Prevention and Therapy.Cancer Res. 2022 Mar 15;82(6):949-965. doi: 10.1158/0008-5472.CAN-21-2297. Cancer Res. 2022. PMID: 34949672 Free PMC article. Review.
-
Protein kinase C-related kinase 1 and 2 play an essential role in thromboxane-mediated neoplastic responses in prostate cancer.Oncotarget. 2015 Sep 22;6(28):26437-56. doi: 10.18632/oncotarget.4664. Oncotarget. 2015. PMID: 26296974 Free PMC article.
-
Arachidonic Acid Metabolite as a Novel Therapeutic Target in Breast Cancer Metastasis.Int J Mol Sci. 2017 Dec 8;18(12):2661. doi: 10.3390/ijms18122661. Int J Mol Sci. 2017. PMID: 29292756 Free PMC article. Review.
-
Human cytochrome P450 enzymes 5-51 as targets of drugs and natural and environmental compounds: mechanisms, induction, and inhibition - toxic effects and benefits.Drug Metab Rev. 2018 Aug;50(3):256-342. doi: 10.1080/03602532.2018.1483401. Drug Metab Rev. 2018. PMID: 30717606 Free PMC article. Review.
-
Comparative analysis of mite genomes reveals positive selection for diet adaptation.Commun Biol. 2021 Jun 3;4(1):668. doi: 10.1038/s42003-021-02173-3. Commun Biol. 2021. PMID: 34083730 Free PMC article.
References
-
- Gupta S, Srivastava M, Ahmad N, Bostwick DG, Mukhtar H. Over-expression of cyclooxygenase-2 in human prostate adenocarcinoma. Prostate. 2000;42:73–78. - PubMed
-
- Lee LM, Pan CC, Cheng CJ, Chi CW, Liu TY. Expression of cyclooxygenase-2 in prostate adenocarcinoma and benign prostatic hyperplasia. Anticancer Res. 2001;21:1291–1294. - PubMed
-
- Yoshimura R, Sano H, Masuda C, Kawamura M, Tsubouchi Y, Chargui J, Yoshimura N, Hla T, Wada S. Expression of cyclooxygenase-2 in prostate carcinoma. Cancer. 2000;89:589–596. - PubMed
Publication types
MeSH terms
Substances
Grants and funding
LinkOut - more resources
Full Text Sources
Other Literature Sources
Medical
Research Materials
