

Overexpression of adenosine kinase in epileptic hippocampus contributes to epileptogenesis
- PMID: 14736855
- PMCID: PMC6729249
- DOI: 10.1523/JNEUROSCI.4781-03.2004
Overexpression of adenosine kinase in epileptic hippocampus contributes to epileptogenesis
Abstract
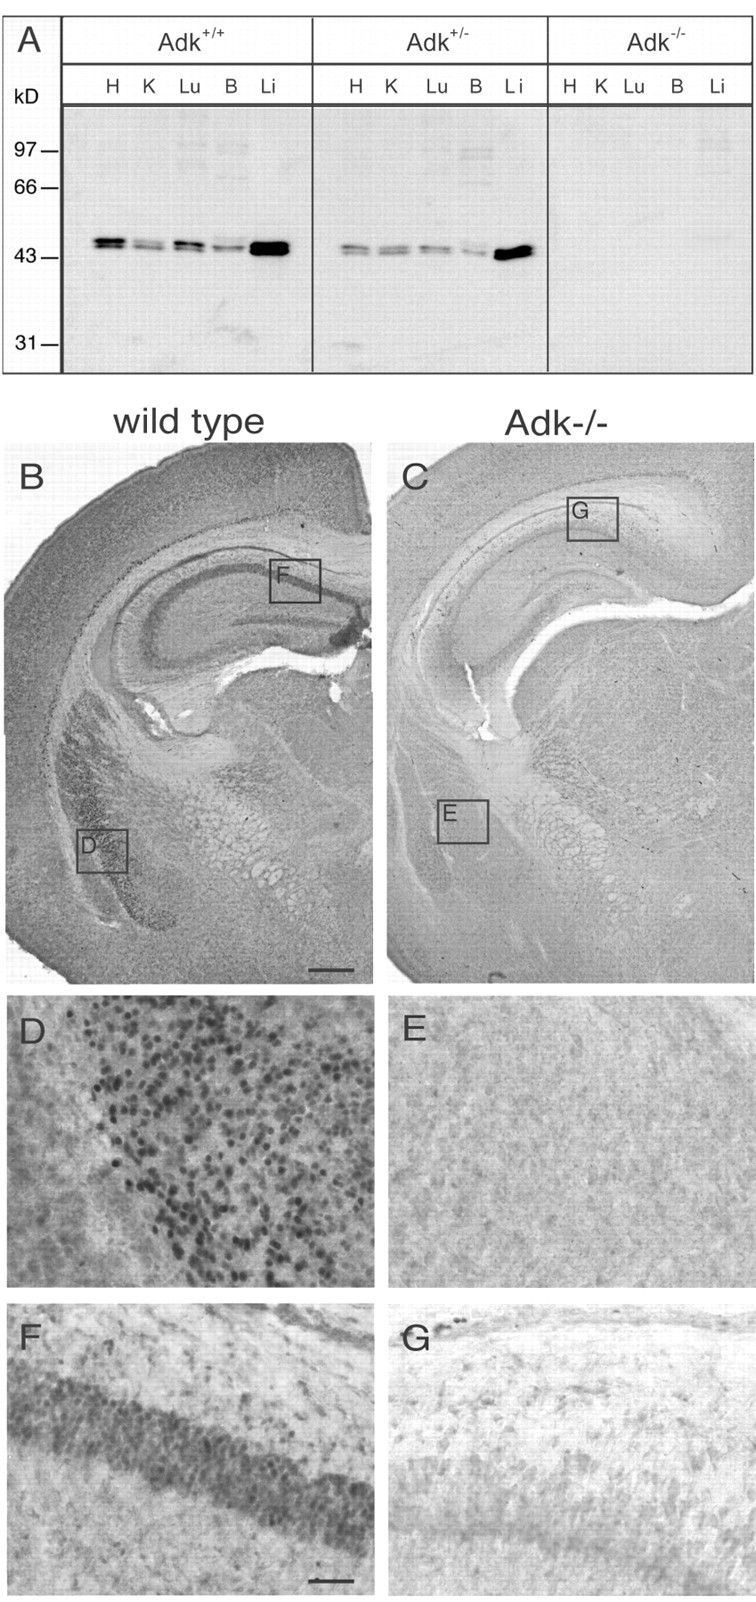
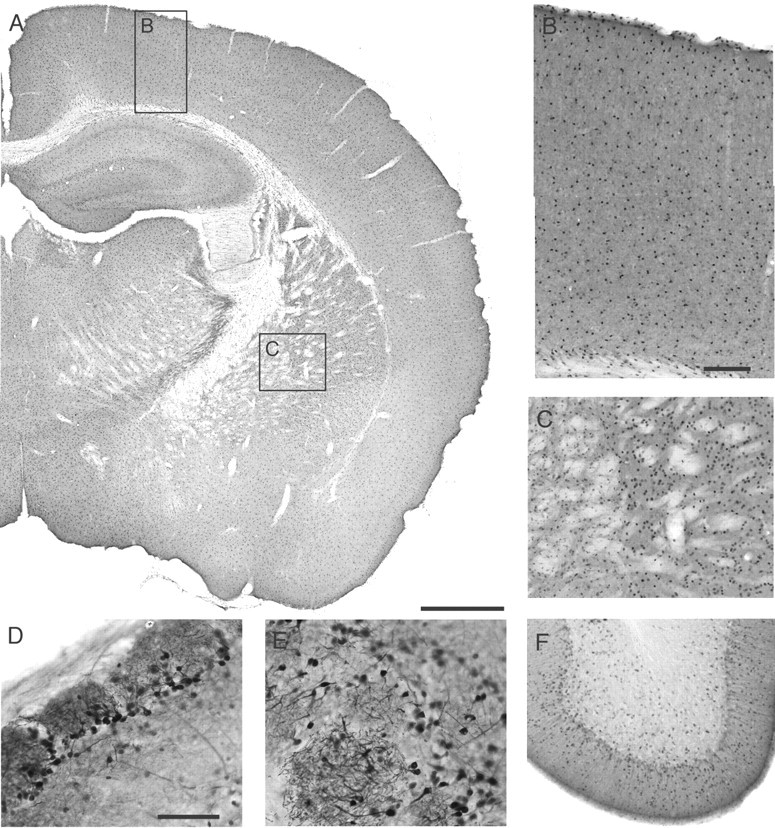
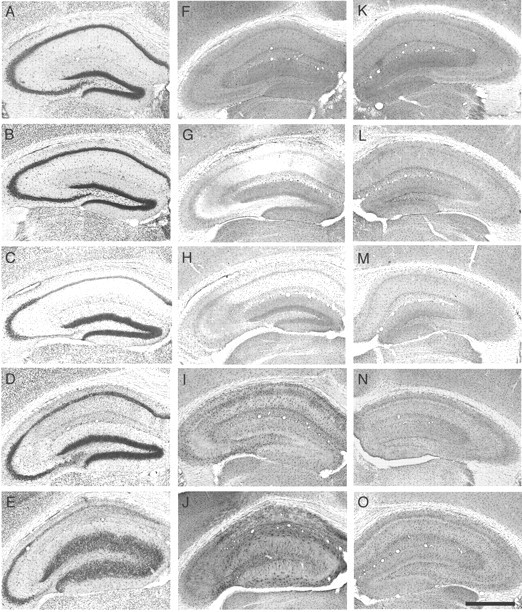
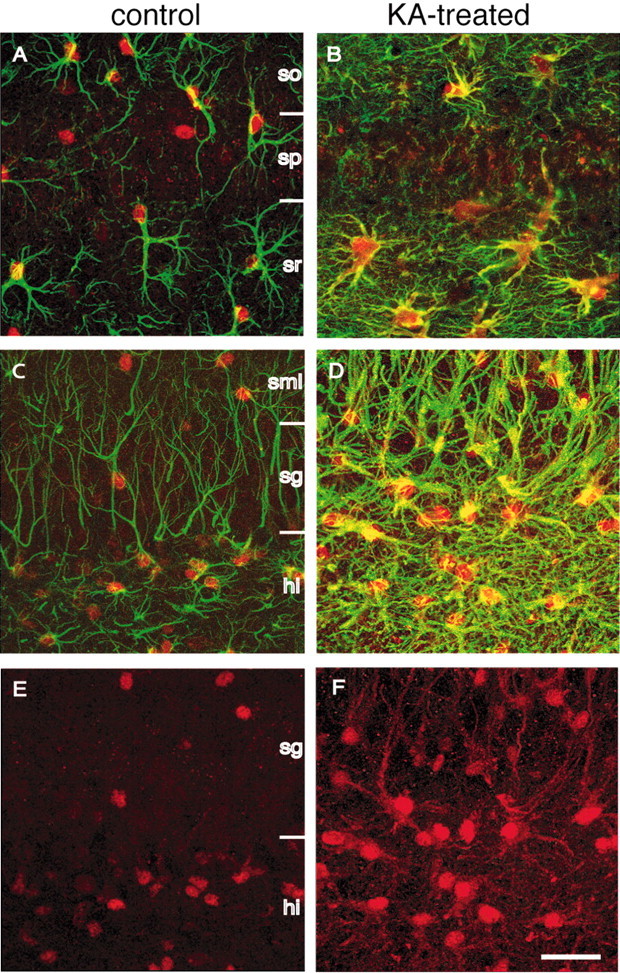
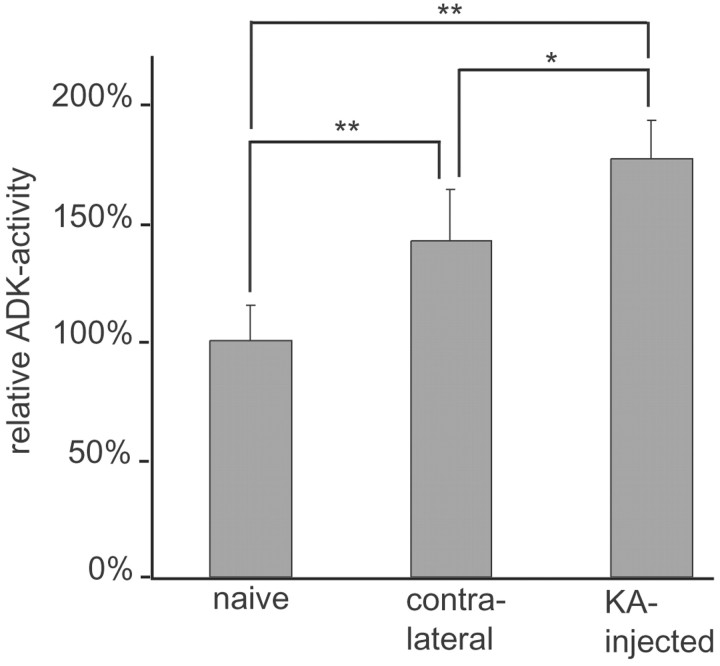
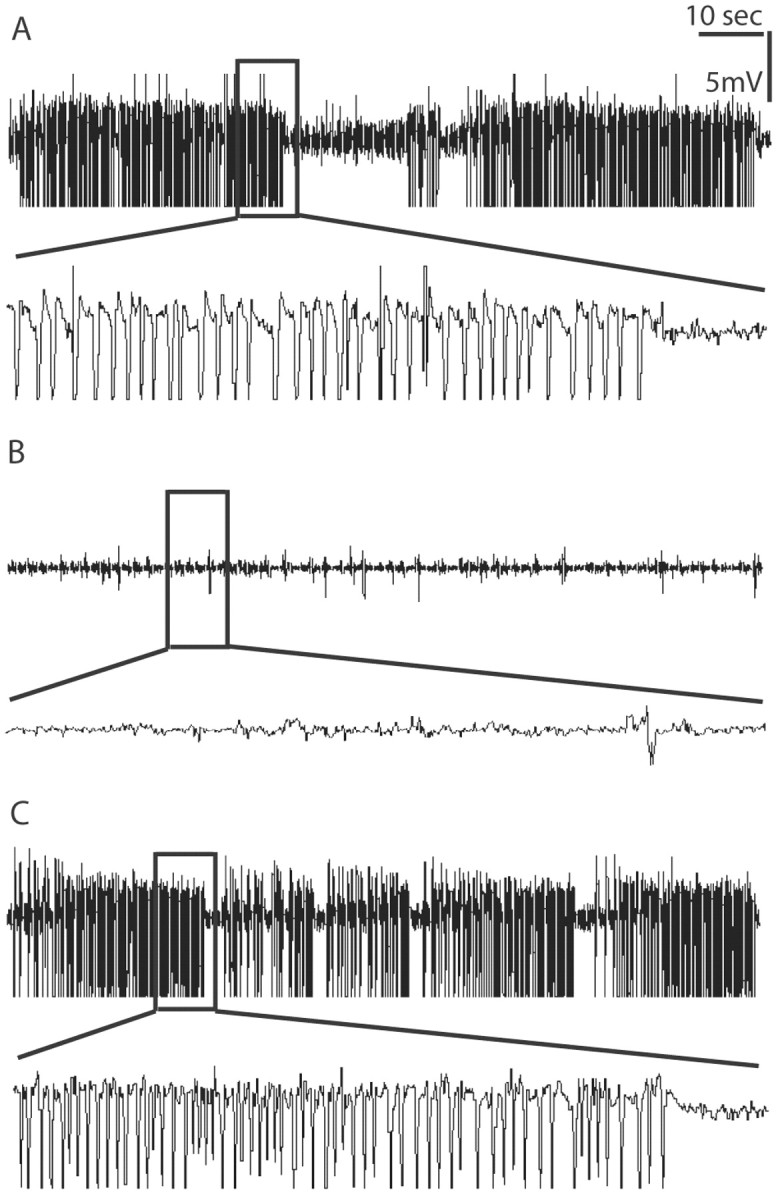
Endogenous adenosine in the brain is thought to prevent the development and spread of seizures via a tonic anticonvulsant effect. Brain levels of adenosine are primarily regulated by the activity of adenosine kinase. To establish a link between adenosine kinase expression and seizure activity, we analyzed the expression of adenosine kinase in the brain of control mice and in a kainic acid-induced mouse model of mesial temporal lobe epilepsy. Immunohistochemical analysis of brain sections of control mice revealed intense staining for adenosine kinase, mainly in astrocytes, which were more or less evenly distributed throughout the brain, as well as in some neurons, particularly in olfactory bulb, striatum, and brainstem. In contrast, hippocampi lesioned by a unilateral kainic acid injection displayed profound astrogliosis and therefore a significant increase in adenosine kinase immunoreactivity accompanied by a corresponding increase of enzyme activity, which paralleled chronic recurrent seizure activity in this brain region. Accordingly, seizures and interictal spikes were suppressed by the injection of a low dose of the adenosine kinase inhibitor 5-iodotubercidin. We conclude that overexpression of adenosine kinase in discrete parts of the epileptic hippocampus may contribute to the development and progression of seizure activity.
Figures
Similar articles
-
Astrogliosis in epilepsy leads to overexpression of adenosine kinase, resulting in seizure aggravation.Brain. 2005 Oct;128(Pt 10):2383-95. doi: 10.1093/brain/awh555. Epub 2005 Jun 1. Brain. 2005. PMID: 15930047
-
Transient use of a systemic adenosine kinase inhibitor attenuates epilepsy development in mice.Epilepsia. 2019 Apr;60(4):615-625. doi: 10.1111/epi.14674. Epub 2019 Feb 27. Epilepsia. 2019. PMID: 30815855 Free PMC article.
-
Recurrent seizures and hippocampal sclerosis following intrahippocampal kainate injection in adult mice: electroencephalography, histopathology and synaptic reorganization similar to mesial temporal lobe epilepsy.Neuroscience. 1999 Mar;89(3):717-29. doi: 10.1016/s0306-4522(98)00401-1. Neuroscience. 1999. PMID: 10199607
-
Role of Adenosine Kinase Inhibitor in Adenosine Augmentation Therapy for Epilepsy: A Potential Novel Drug for Epilepsy.Curr Drug Targets. 2020;21(3):252-257. doi: 10.2174/1389450119666191014104347. Curr Drug Targets. 2020. PMID: 31633474 Review.
-
The role of adenosine in epilepsy.Brain Res Bull. 2019 Sep;151:46-54. doi: 10.1016/j.brainresbull.2018.11.008. Epub 2018 Nov 20. Brain Res Bull. 2019. PMID: 30468847 Free PMC article. Review.
Cited by
-
Adenosine kinase: An epigenetic modulator in development and disease.Neurochem Int. 2021 Jul;147:105054. doi: 10.1016/j.neuint.2021.105054. Epub 2021 May 5. Neurochem Int. 2021. PMID: 33961946 Free PMC article. Review.
-
Adenosine Kinase Inhibition Protects against Cranial Radiation-Induced Cognitive Dysfunction.Front Mol Neurosci. 2016 Jun 3;9:42. doi: 10.3389/fnmol.2016.00042. eCollection 2016. Front Mol Neurosci. 2016. PMID: 27375429 Free PMC article.
-
Homeostatic control of brain function - new approaches to understand epileptogenesis.Front Cell Neurosci. 2013 Jul 16;7:109. doi: 10.3389/fncel.2013.00109. eCollection 2013. Front Cell Neurosci. 2013. PMID: 23882181 Free PMC article.
-
Putative Role of Adenosine A1 Receptors in Exogenous Ketone Supplements-Evoked Anti-Epileptic Effect.Int J Mol Sci. 2024 Sep 12;25(18):9869. doi: 10.3390/ijms25189869. Int J Mol Sci. 2024. PMID: 39337356 Free PMC article. Review.
-
Adenosine augmentation ameliorates psychotic and cognitive endophenotypes of schizophrenia.J Clin Invest. 2012 Jul;122(7):2567-77. doi: 10.1172/JCI62378. Epub 2012 Jun 18. J Clin Invest. 2012. PMID: 22706302 Free PMC article.
References
-
- Boison D, Scheurer L, Tseng JL, Aebischer P, Mohler H (1999) Seizure suppression in kindled rats by intraventricular grafting of an adenosine releasing synthetic polymer. Exp Neurol 160: 164-174. - PubMed
-
- Boison D, Huber A, Padrun V, Déglon N, Aebischer P, Möhler H (2002a) Seizure suppression by adenosine releasing cells is independent of seizure frequency. Epilepsia 43: 788-796. - PubMed
-
- Bouilleret V, Ridoux V, Depaulis A, Marescaux C, Nehlig A, Le Gal La Salle G (1999) Recurrent seizures and hippocampal sclerosis following intrahippocampal kainate injection in adult mice: electroencephalography, histopathology and synaptic reorganization similar to mesial temporal lobe epilepsy. Neuroscience 89: 717-729. - PubMed
Publication types
MeSH terms
Substances
LinkOut - more resources
Full Text Sources
Molecular Biology Databases
Miscellaneous