Pattern of diversity in the genomic region near the maize domestication gene tb1
- PMID: 14701910
- PMCID: PMC321743
- DOI: 10.1073/pnas.2237049100
Pattern of diversity in the genomic region near the maize domestication gene tb1
Abstract
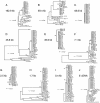
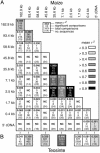
Domesticated maize and its wild ancestor (teosinte) differ strikingly in morphology and afford an opportunity to examine the connection between strong selection and diversity in a major crop species. The tb1 gene largely controls the increase in apical dominance in maize relative to teosinte, and a region of the tb1 locus 5' to the transcript sequence was a target of selection during maize domestication. To better characterize the impact of selection at a major "domestication" locus, we have sequenced the upstream tb1 genomic region and systematically sampled nucleotide diversity for sites located as far as 163 kb upstream to tb1. Our analyses define a selective sweep of approximately 60-90 kb 5' to the tb1 transcribed sequence. The selected region harbors a mixture of unique sequences and large repetitive elements, but it contains no predicted genes. Diversity at the nearest 5' gene to tb1 is typical of that for neutral maize loci, indicating that selection at tb1 has had a minimal impact on the surrounding chromosomal region. Our data also show low intergenic linkage disequilibrium in the region and suggest that selection has had a minor role in shaping the pattern of linkage disequilibrium that is observed. Finally, our data raise the possibility that maize-like tb1 haplotypes are present in extant teosinte populations, and our findings also suggest a model of tb1 gene regulation that differs from traditional views of how plant gene expression is controlled.
Figures


Similar articles
-
Estimating a nucleotide substitution rate for maize from polymorphism at a major domestication locus.Mol Biol Evol. 2005 Nov;22(11):2304-12. doi: 10.1093/molbev/msi228. Epub 2005 Aug 3. Mol Biol Evol. 2005. PMID: 16079248
-
Patterns of molecular evolution associated with two selective sweeps in the Tb1-Dwarf8 region in maize.Genetics. 2008 Oct;180(2):1107-21. doi: 10.1534/genetics.108.088849. Epub 2008 Sep 9. Genetics. 2008. PMID: 18780751 Free PMC article.
-
The evolution of apical dominance in maize.Nature. 1997 Apr 3;386(6624):485-8. doi: 10.1038/386485a0. Nature. 1997. PMID: 9087405
-
The Past, Present, and Future of Maize Improvement: Domestication, Genomics, and Functional Genomic Routes toward Crop Enhancement.Plant Commun. 2019 Nov 27;1(1):100010. doi: 10.1016/j.xplc.2019.100010. eCollection 2020 Jan 13. Plant Commun. 2019. PMID: 33404535 Free PMC article. Review.
-
Genomic screening for artificial selection during domestication and improvement in maize.Ann Bot. 2007 Nov;100(5):967-73. doi: 10.1093/aob/mcm173. Epub 2007 Aug 18. Ann Bot. 2007. PMID: 17704539 Free PMC article. Review.
Cited by
-
Large haplotypes highlight a complex age structure within the maize pan-genome.Genome Res. 2023 Mar;33(3):359-370. doi: 10.1101/gr.276705.122. Epub 2023 Feb 28. Genome Res. 2023. PMID: 36854668 Free PMC article.
-
The genetic architecture of shoot branching in Arabidopsis thaliana: a comparative assessment of candidate gene associations vs. quantitative trait locus mapping.Genetics. 2007 Jun;176(2):1223-36. doi: 10.1534/genetics.107.071928. Epub 2007 Apr 15. Genetics. 2007. PMID: 17435248 Free PMC article.
-
Strong linkage disequilibrium near the selected Yr17 resistance gene in a wheat experimental population.Theor Appl Genet. 2007 Mar;114(5):787-802. doi: 10.1007/s00122-006-0477-x. Epub 2006 Dec 20. Theor Appl Genet. 2007. PMID: 17177061
-
Allele frequency distribution under recurrent selective sweeps.Genetics. 2006 Mar;172(3):1967-78. doi: 10.1534/genetics.105.048447. Epub 2005 Dec 15. Genetics. 2006. PMID: 16361239 Free PMC article.
-
MaizeSNPDB: A comprehensive database for efficient retrieve and analysis of SNPs among 1210 maize lines.Comput Struct Biotechnol J. 2019 Nov 7;17:1377-1383. doi: 10.1016/j.csbj.2019.10.003. eCollection 2019. Comput Struct Biotechnol J. 2019. PMID: 31762961 Free PMC article.
References
-
- Tanksley, S. D. & McCouch, S. R. (1997) Science 277, 1063–1066. - PubMed
-
- Buckler, E. S., IV, Thornsberry, J. M. & Kresovich, S. (2001) Genet. Res. 77, 213–218. - PubMed
-
- Frary, A., Nesbitt, T. C., Grandillo, S., Knaap, E., Cong, B., Liu, J., Meller, J., Elber, R., Alpert, K. B. & Tanksley, S. D. (2000) Science 289, 85–88. - PubMed
-
- Peng, J., Richards, D. E., Hartley, N. M., Murphy, G. P., Devos, K. M., Flintham, J. E., Beales, J., Fish, L. J., Worland, A. J., Pelica, F., et al. (1999) Nature 400, 256–261. - PubMed
Publication types
MeSH terms
Substances
Associated data
- Actions
- Actions
- Actions
- Actions
- Actions
- Actions
- Actions
- Actions
- Actions
- Actions
- Actions
- Actions
- Actions
- Actions
- Actions
- Actions
- Actions
- Actions
- Actions
- Actions
- Actions
- Actions
- Actions
- Actions
- Actions
- Actions
- Actions
- Actions
- Actions
- Actions
- Actions
- Actions
- Actions
- Actions
- Actions
- Actions
- Actions
- Actions
- Actions
- Actions
- Actions
- Actions
- Actions
- Actions
- Actions
- Actions
- Actions
- Actions
- Actions
- Actions
- Actions
- Actions
- Actions
- Actions
- Actions
- Actions
- Actions
- Actions
- Actions
- Actions
- Actions
- Actions
- Actions
- Actions
- Actions
- Actions
- Actions
- Actions
- Actions
- Actions
- Actions
- Actions
- Actions
- Actions
- Actions
- Actions
- Actions
- Actions
- Actions
- Actions
- Actions
- Actions
- Actions
- Actions
- Actions
- Actions
- Actions
- Actions
- Actions
- Actions
- Actions
- Actions
- Actions
- Actions
- Actions
- Actions
- Actions
- Actions
- Actions
- Actions
- Actions
- Actions
- Actions
- Actions
- Actions
- Actions
- Actions
- Actions
- Actions
- Actions
- Actions
- Actions
- Actions
- Actions
- Actions
- Actions
- Actions
- Actions
- Actions
- Actions
- Actions
- Actions
- Actions
- Actions
- Actions
- Actions
- Actions
- Actions
- Actions
- Actions
- Actions
- Actions
- Actions
- Actions
- Actions
- Actions
- Actions
- Actions
- Actions
- Actions
- Actions
- Actions
- Actions
- Actions
- Actions
- Actions
- Actions
- Actions
- Actions
- Actions
- Actions
- Actions
- Actions
- Actions
- Actions
- Actions
- Actions
- Actions
- Actions
- Actions
- Actions
- Actions
- Actions
- Actions
- Actions
- Actions
- Actions
- Actions
- Actions
- Actions
- Actions
- Actions
- Actions
- Actions
- Actions
- Actions
- Actions
- Actions
- Actions
- Actions
- Actions
- Actions
- Actions
- Actions
- Actions
- Actions
- Actions
- Actions
- Actions
- Actions
- Actions
- Actions
- Actions
- Actions
- Actions
- Actions
- Actions
- Actions
- Actions
- Actions
- Actions
- Actions
- Actions
- Actions
- Actions
- Actions
- Actions
- Actions
- Actions
- Actions
- Actions
- Actions
- Actions
- Actions
- Actions
- Actions
- Actions
- Actions
- Actions
- Actions
- Actions
- Actions
- Actions
- Actions
- Actions
- Actions
- Actions
- Actions
- Actions
- Actions
- Actions
- Actions
- Actions
- Actions
- Actions
- Actions
- Actions
- Actions
- Actions
- Actions
- Actions
- Actions
- Actions
- Actions
- Actions
- Actions
- Actions
- Actions
- Actions
- Actions
- Actions
- Actions
- Actions
- Actions
- Actions
- Actions
- Actions
- Actions
- Actions
- Actions
- Actions
- Actions
- Actions
- Actions
- Actions
- Actions
- Actions
- Actions
- Actions
- Actions
- Actions
- Actions
- Actions
- Actions
- Actions
Grants and funding
LinkOut - more resources
Full Text Sources
Other Literature Sources

