In vivo analysis of autophagy in response to nutrient starvation using transgenic mice expressing a fluorescent autophagosome marker
- PMID: 14699058
- PMCID: PMC363084
- DOI: 10.1091/mbc.e03-09-0704
In vivo analysis of autophagy in response to nutrient starvation using transgenic mice expressing a fluorescent autophagosome marker
Abstract
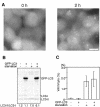
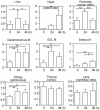
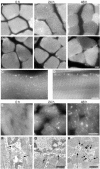
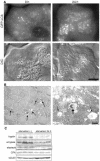
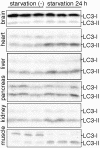
Macroautophagy mediates the bulk degradation of cytoplasmic components. It accounts for the degradation of most long-lived proteins: cytoplasmic constituents, including organelles, are sequestered into autophagosomes, which subsequently fuse with lysosomes, where degradation occurs. Although the possible involvement of autophagy in homeostasis, development, cell death, and pathogenesis has been repeatedly pointed out, systematic in vivo analysis has not been performed in mammals, mainly because of a limitation of monitoring methods. To understand where and when autophagy occurs in vivo, we have generated transgenic mice systemically expressing GFP fused to LC3, which is a mammalian homologue of yeast Atg8 (Aut7/Apg8) and serves as a marker protein for autophagosomes. Fluorescence microscopic analyses revealed that autophagy is differently induced by nutrient starvation in most tissues. In some tissues, autophagy even occurs actively without starvation treatments. Our results suggest that the regulation of autophagy is organ dependent and the role of autophagy is not restricted to the starvation response. This transgenic mouse model is a useful tool to study mammalian autophagy.
Figures




Similar articles
-
Autophagosomes in GFP-LC3 Transgenic Mice.Methods Mol Biol. 2008;445:119-24. doi: 10.1007/978-1-59745-157-4_7. Methods Mol Biol. 2008. PMID: 18425446
-
Using photoactivatable proteins to monitor autophagosome lifetime.Methods Enzymol. 2009;452:25-45. doi: 10.1016/S0076-6879(08)03603-3. Methods Enzymol. 2009. PMID: 19200874
-
Monitoring the autophagy-endolysosomal system using monomeric Keima-fused MAP1LC3B.PLoS One. 2020 Jun 8;15(6):e0234180. doi: 10.1371/journal.pone.0234180. eCollection 2020. PLoS One. 2020. PMID: 32511278 Free PMC article.
-
Methods for monitoring autophagy.Int J Biochem Cell Biol. 2004 Dec;36(12):2491-502. doi: 10.1016/j.biocel.2004.02.005. Int J Biochem Cell Biol. 2004. PMID: 15325587 Review.
-
Pathophysiological role of autophagy: lesson from autophagy-deficient mouse models.Exp Anim. 2011;60(4):329-45. doi: 10.1538/expanim.60.329. Exp Anim. 2011. PMID: 21791873 Review.
Cited by
-
Molecular characterization of LC3-associated phagocytosis reveals distinct roles for Rubicon, NOX2 and autophagy proteins.Nat Cell Biol. 2015 Jul;17(7):893-906. doi: 10.1038/ncb3192. Epub 2015 Jun 22. Nat Cell Biol. 2015. Retraction in: Nat Cell Biol. 2024 Apr;26(4):660. doi: 10.1038/s41556-024-01383-1 PMID: 26098576 Free PMC article. Retracted.
-
Brain-enriched RagB isoforms regulate the dynamics of mTORC1 activity through GATOR1 inhibition.Nat Cell Biol. 2022 Sep;24(9):1407-1421. doi: 10.1038/s41556-022-00977-x. Epub 2022 Sep 12. Nat Cell Biol. 2022. PMID: 36097071 Free PMC article.
-
Fanconi Anemia Proteins Function in Mitophagy and Immunity.Cell. 2016 May 5;165(4):867-81. doi: 10.1016/j.cell.2016.04.006. Epub 2016 Apr 28. Cell. 2016. PMID: 27133164 Free PMC article.
-
Distinct modulated pupil function system for real-time imaging of living cells.PLoS One. 2012;7(9):e44028. doi: 10.1371/journal.pone.0044028. Epub 2012 Sep 4. PLoS One. 2012. PMID: 22962597 Free PMC article.
-
Establishment of a novel fluorescence-based method to evaluate chaperone-mediated autophagy in a single neuron.PLoS One. 2012;7(2):e31232. doi: 10.1371/journal.pone.0031232. Epub 2012 Feb 7. PLoS One. 2012. PMID: 22363588 Free PMC article.
References
-
- Ariano, M.A., Armstrong, R.B., and Edgerton, V.R. (1973). Hindlimb muscle fiber populations of five mammals. J. Histochem. Cytochem. 21, 51-55. - PubMed
-
- Attaix, D. and Taillandier, D. (1998). The critical role of the ubiquitin-proteasome pathway in muscle wasting in comparison to lysosomal and Ca2+- dependent system. JAI Press Inc., London.
-
- Bendayan, M., Bruneau, A., and Morisset, J. (1985). Morphometrical and immunocytochemical studies on rat pancreatic acinar cells under control and experimental conditions. Biol. Cell 54, 227-234. - PubMed
-
- Bhat, S.P. (2001). The ocular lens epithelium. Biosci. Rep. 21, 537-563. - PubMed
-
- Blommaart, E.F.C., Luiken, J.J.F.P., and Meijer, A.J. (1997). Autophagic proteolysis: control and specificity. Histochem. J. 29, 365-385. - PubMed
Publication types
MeSH terms
Substances
LinkOut - more resources
Full Text Sources
Other Literature Sources
Molecular Biology Databases
Research Materials

