

Hydrodynamic forces applied on intercellular bonds, soluble molecules, and cell-surface receptors
- PMID: 14695302
- PMCID: PMC1303826
- DOI: 10.1016/S0006-3495(04)74136-3
Hydrodynamic forces applied on intercellular bonds, soluble molecules, and cell-surface receptors
Abstract
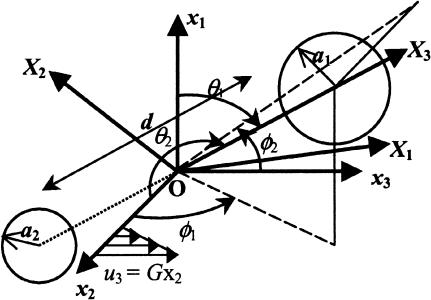
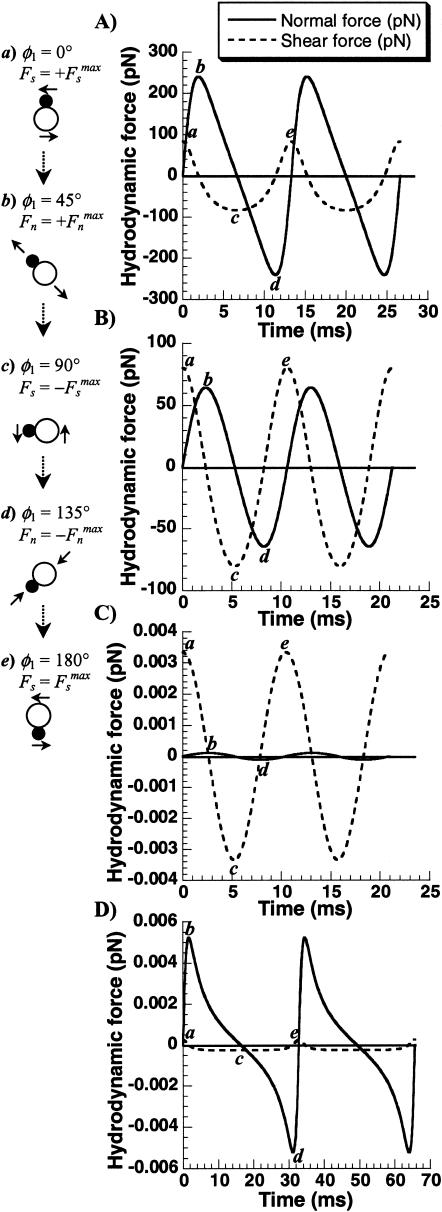
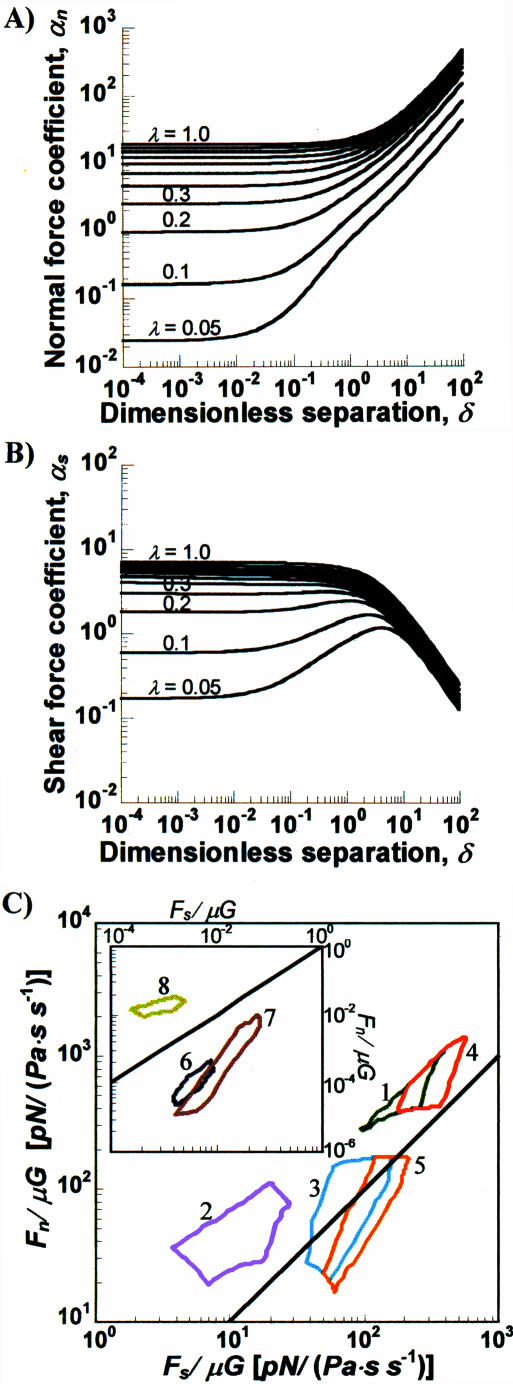
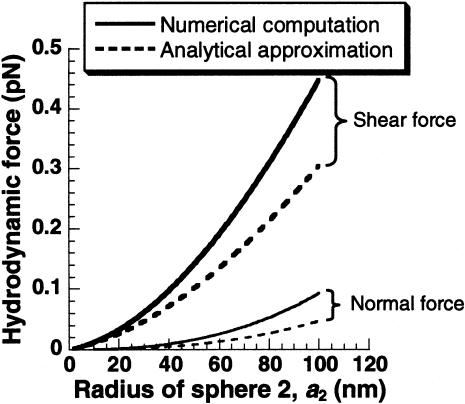
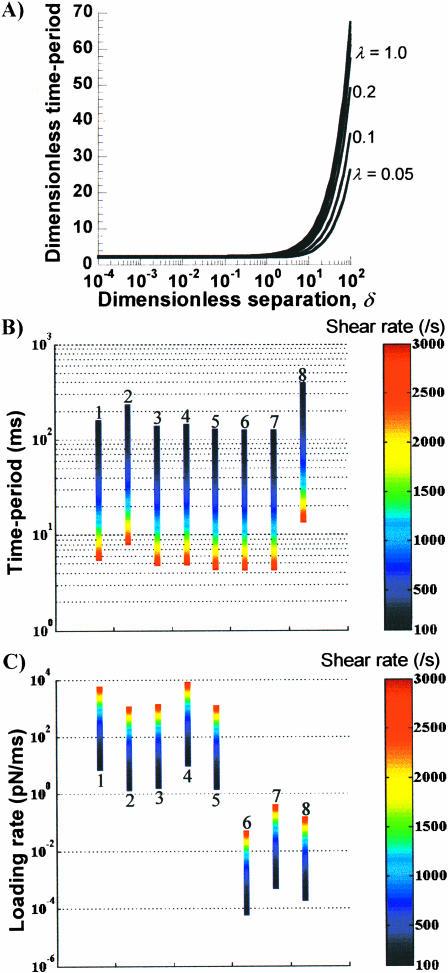
Cells and biomolecules exposed to blood circulation experience hydrodynamic forces that affect their function. We present a methodology to estimate fluid forces and force loading rates applied on cellular aggregates, cell-surface proteins, and soluble molecules. Low Reynolds-number hydrodynamic theory is employed. Selected results are presented for biological cases involving platelets, neutrophils, tumor cells, GpIb-like cell-surface receptors, and plasma von Willebrand factor (vWF)-like soluble proteins. Calculations reveal the following: 1), upon application of constant linear shear, cell aggregates and biomolecules experience time-varying forces due to their tumbling motion. 2), In comparison to neutrophil homotypic aggregates, the maximum force applied on neutrophil-platelet aggregates is approximately threefold lower. Thus, alterations in cell size may dramatically alter adhesion molecule requirement for efficient cell binding. Whereas peak forces on homotypic cell doublets are tensile, shear forces dominate in heterotypic doublets with radius ratio <0.3. 3), The peak forces on platelet GpIb and von Willebrand factor are of comparable magnitude. However, they are orders-of-magnitude lower than those applied on intercellular bonds. Charts are provided to rapidly evaluate the magnitude of hydrodynamic force and rotation time-period occurring in any given experiment. The calculation scheme may find application in studies of vascular biology and receptor biophysics.
Figures
Similar articles
-
Micro-scale dynamic simulation of erythrocyte-platelet interaction in blood flow.Ann Biomed Eng. 2008 Jun;36(6):905-20. doi: 10.1007/s10439-008-9478-z. Epub 2008 Mar 11. Ann Biomed Eng. 2008. PMID: 18330703
-
Mechanics of transient platelet adhesion to von Willebrand factor under flow.Biophys J. 2005 Feb;88(2):1432-43. doi: 10.1529/biophysj.104.047001. Epub 2004 Nov 8. Biophys J. 2005. PMID: 15533923 Free PMC article.
-
Hydrodynamic effects and receptor interactions of platelets and their aggregates in linear shear flow.Biophys J. 1997 Nov;73(5):2819-35. doi: 10.1016/S0006-3495(97)78311-5. Biophys J. 1997. PMID: 9370476 Free PMC article.
-
Platelet-vessel wall interactions in thrombosis and restenosis role of von Willebrand factor.Verh K Acad Geneeskd Belg. 1997;59(3):161-83. Verh K Acad Geneeskd Belg. 1997. PMID: 9490916 Review.
-
The effect of shear stress on protein conformation: Physical forces operating on biochemical systems: The case of von Willebrand factor.Biophys Chem. 2010 Dec;153(1):1-8. doi: 10.1016/j.bpc.2010.07.002. Epub 2010 Aug 11. Biophys Chem. 2010. PMID: 20797815 Review.
Cited by
-
Internal Tensile Force and A2 Domain Unfolding of von Willebrand Factor Multimers in Shear Flow.Biophys J. 2018 Nov 20;115(10):1860-1871. doi: 10.1016/j.bpj.2018.09.001. Epub 2018 Sep 13. Biophys J. 2018. PMID: 30287111 Free PMC article.
-
Role of calcium in regulating the intra- and extracellular cleavage of von Willebrand factor by the protease ADAMTS13.Blood Adv. 2017 Oct 20;1(23):2063-2074. doi: 10.1182/bloodadvances.2017009027. eCollection 2017 Oct 24. Blood Adv. 2017. PMID: 29296853 Free PMC article.
-
Structure, folding dynamics, and amyloidogenesis of D76N β2-microglobulin: roles of shear flow, hydrophobic surfaces, and α-crystallin.J Biol Chem. 2013 Oct 25;288(43):30917-30. doi: 10.1074/jbc.M113.498857. Epub 2013 Sep 6. J Biol Chem. 2013. PMID: 24014031 Free PMC article.
-
Structure-function and regulation of ADAMTS-13 protease.J Thromb Haemost. 2013 Jun;11 Suppl 1(0 1):11-23. doi: 10.1111/jth.12221. J Thromb Haemost. 2013. PMID: 23809107 Free PMC article. Review.
-
Force-Regulated Refolding of the Mechanosensory Domain in the Platelet Glycoprotein Ib-IX Complex.Biophys J. 2019 May 21;116(10):1960-1969. doi: 10.1016/j.bpj.2019.03.037. Epub 2019 Apr 8. Biophys J. 2019. PMID: 31030883 Free PMC article.
References
-
- Adler, P. M. 1981. Interaction of unequal spheres. I. Hydrodynamic interaction: colloidal forces. J. Coll. Interf. Sci. 84:461–474.
-
- Alon, R., D. A. Hammer, and T. A. Springer. 1995. Lifetime of the P-selectin-carbohydrate bond and its response to tensile force in hydrodynamic flow. Nature. 374:539–542. - PubMed
-
- Arp, P. A., and S. G. Mason. 1977. The kinetics of flowing dispersions. VIII. Doublets of rigid spheres (theoretical). J. Coll. Interf. Sci. 61:21–43.
-
- Ballard, M. C. 1987. Atlas of Blood Cells in Health and Disease. United States Department of Health and Human Services, Atlanta, GA.
-
- Batchelor, G. K. 1967. An Introduction to Fluid Dynamics. Cambridge University Press, Cambridge.
Publication types
MeSH terms
Substances
Grants and funding
LinkOut - more resources
Full Text Sources
Miscellaneous
